Automatic Fibonatti
"Automatic Fibonatti" logo
01/09/2025
1
Desktop
Since 05/02/2025
Sales
11

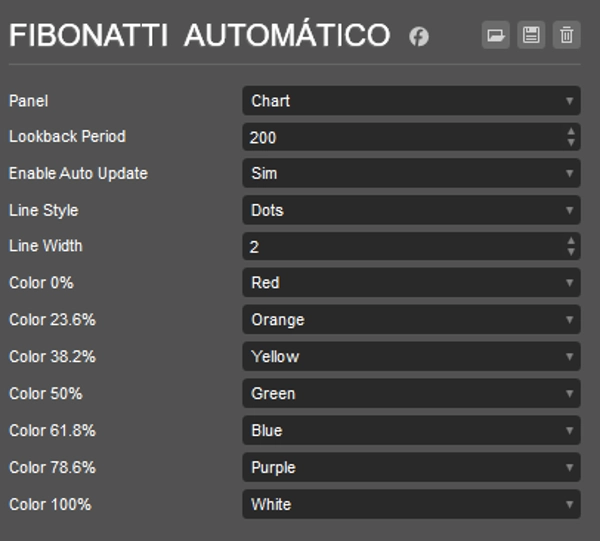
Auto Fibonacci for cTrader


Automatically identify key price levels — fully customizable to your strategy.
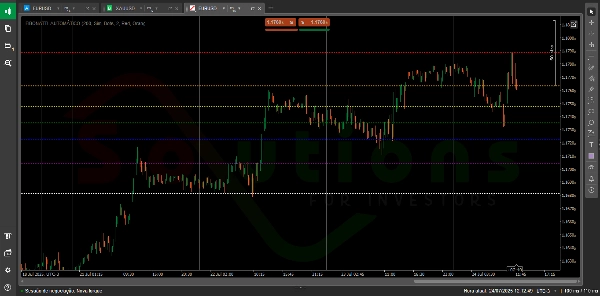
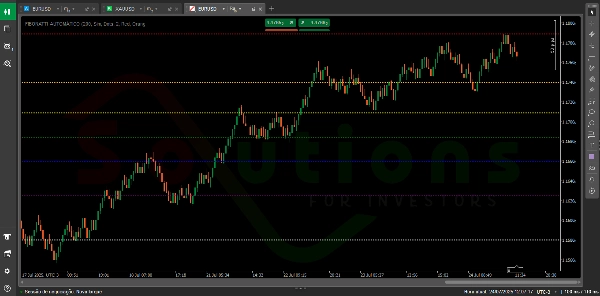
Auto Fibonacci is a smart and flexible indicator that automatically draws Fibonacci retracement levels based on the highest and lowest prices over a user-defined period. What sets it apart is its full customization: personalize each Fibonacci level’s color, line style, and thickness to suit your visual preferences and trading strategy. It also features real-time updates, so your chart always reflects the latest price action — no manual adjustments needed.

0.0
Reviews: 0
Customer reviews
No reviews for this product yet. Already tried it? Be the first to tell others!
More from this author
Renko Reversal
Renko Reversal catches powerful wick rejections on cTrader.
VolumeColorBar
Color Volume Bars – Visualize Market Strength Instantly
Indicator
Breakout
VIX - volatility indicator
Ride the Volatility – Smart VIX Tool
BOT REJECTION - SOLUTIONS FOR INVESTORS
Rejection Bot – Precision Trading at Key Levels
Automatic Fibonatti - Renko
Automatically plots Fibonacci retracement levels using the highest and lowest points of a customizable time range.
Indicator
Indices
Prop
Commodities
+3
ADX Indicator_noSourceCode
Identify Trend Strength with Absolute Precision on cTrader
Indicator
Breakout
VIX - volatility indicator - Renko
Volatility indicator for Renko.
Indicator
Indices
RSI
RSI
RSI Pro Tool – Overbought & Oversold Made Easy
You may also like
Indicator
Indices
XAUUSD
Commodities
+8
ATR on Chart
Plots the ATR on the chart for easy visualization.
VWAP - London Open
VWAP Set to London Open
Indicator
Indices
Prop
Commodities
+3
Period Separator
Period Separator that shows on all timeframes including renko and range bars.
Indicator
ZigZag
VWAP
Weis & Wyckoff System v2.0
MM-Symbol Info (free)
Enhance the trading experience with real-time Spread, Time To Close, rPNL, uPNL, PNL and minimalistic Bid / Ask lines
Indicator
RSI
Signal
Wyckoff Toolkit [Iridio Capital]
The Wyckoff Toolkit is the ultimate ally for traders seeking to decode the market through the lens of "smart money."
Order Flow Ticks v2.0
Simple MACD Histogram
Simple MACD Histogram with color-coded rising (green) and falling (red) momentum bars.
Indicator
RSI
XAUUSD
Breakout
+4
S&R Structural ZigZag
"Detects swings 🎯, draws zigzag trends 📈📉, support/resistance ⏹️, labels HH/HL/LH/LL, Tracks market structure 🚀🐻."
Indicator
RSI
Breakout
XAUUSD
+5
Zones Supply Demand
📊Zones Supply & Demand: Identifies key price levels with high volume concentration, marking Supply/Demand Zones & Marke
MMXM Structure by Ludwig
MMXM Structure by LudwigICT – Professional Market Structure Mapping Tool
Indicator
Indices
Breakout
Prop
+2
Price Change Bundle 1.0 BT
Price Change Bundle 3-in-1 Levels • Bars • Histogram. Secret of Price Change
Indicator
NAS100
NZDUSD
Breakout
+18
Breakout Channels by PrimeQuant
Detect institutional breakout zones with smart volume & channel analysis — by PrimeQuant.
Multi_TF Candlestick Chart Overlay
Perfect for traders who demand a clear overview of multiple timeframes at a glance.
Indicator
RSI
Indices
Stocks
+3
FiboTrend-Pro V2
New version of one of my favorites includes Fibonacci and moving average convergence divergence lines
ScalpingSignalIndicator
Scalping signals with EMA/RSI/ATR logic. Visual cloud shows precise entry and exit zones. Built for M1/M5 scalpers.
Indicator
RSI
Breakout
Supertrend
All Support and Resistance Levels
"Identify key market zones and visualize support/resistance from multiple timeframes on a single chart.
Indicator
Indices
Stocks
Forex
+1
Bullet Chart Trend
Unique Pyramid Design , Clear Price Action Trend