
PivotLevels
Indicator
1 purchases
Version 1.0, Sep 2025
Windows, Mac
4.5
Reviews: 2
Description
Pivot Points Indicator
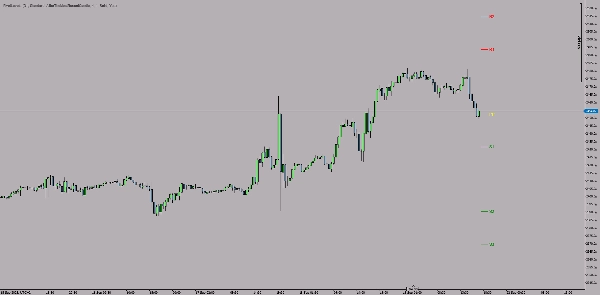
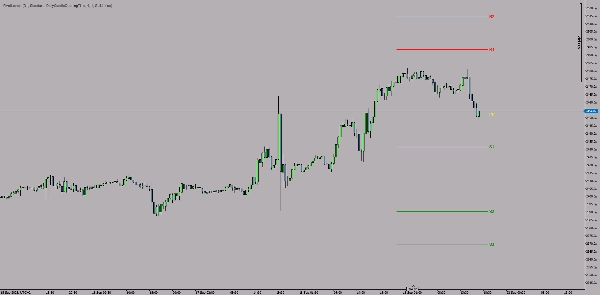
The Pivot Points is a technical indicator for the cTrader platform that automatically calculates and displays pivot points as trendlines on the chart.
Key Features:
🎯 Pivot Types:
- Standard Pivot Points
- Fibonacci Pivot Points
- Woodie Pivot Points
- Camarilla Pivot Points
📊 Levels:
- Central Pivot Point (PP) - yellow
- Resistance levels (R1, R2, R3) - red
- Support levels (S1, S2, S3) - green
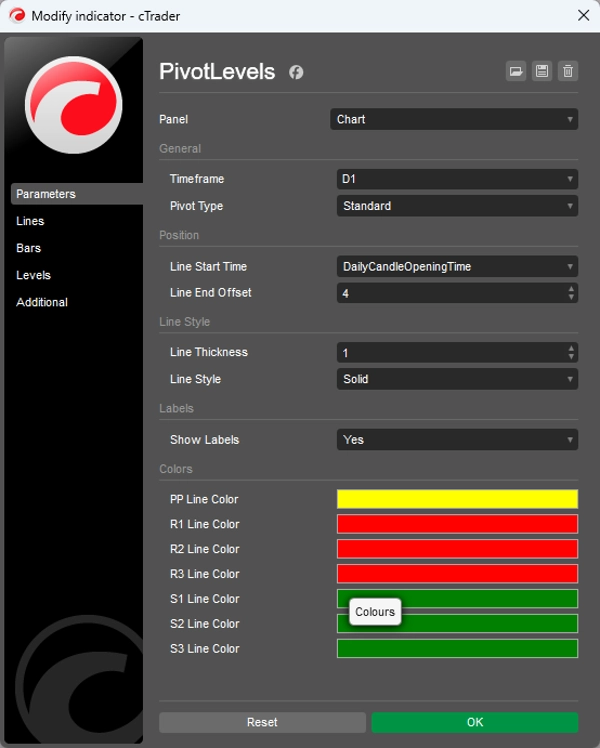
⚙️ Customizable Settings:
- Timeframe: Daily, weekly, or other timeframe selection
- Line style: Thickness (1-5) and type (solid, dashed, etc.)
- Positioning: Line start time and length
- Colors: Each level's color individually adjustable
- Labels: Toggle text labels on/off
💡 Usage:
The indicator calculates pivot levels based on the previous period's (day/week) high, low, close (and open) values, which identify key support and resistance areas for the next trading period.
Ideal for swing and day traders who apply strategies based on technical levels.
Summary
AI summary
PivotLevels is a technical indicator for the cTrader platform that automatically calculates and displays pivot points as trendlines on trading charts. It supports multiple pivot point calculation methods, including Standard, Fibonacci, Woodie, and Camarilla pivots. The indicator plots key levels such as the Central Pivot Point (PP) in yellow, resistance levels (R1, R2, R3) in red, and support levels (S1, S2, S3) in green.
Users can customize various settings, including the timeframe for pivot calculation (daily, weekly, or others), line style (thickness and type), line positioning (start time and length), colors for each level, and the option to toggle text labels on or off. The pivot levels are derived from the previous period’s high, low, close, and open prices, helping identify potential support and resistance zones for the upcoming trading period.
This indicator is suitable for traders who use technical levels in their strategies, particularly swing and day traders. It supports multiple markets such as forex, indices, commodities, cryptocurrencies, and stocks.
Indicator profile
Customer reviews
4.5
Reviews: 2
5 | 50 % | |
4 | 50 % | |
3 | 0 % | |
2 | 0 % | |
1 | 0 % |
Customer reviews
September 30, 2025
The review gets easier when the decision feels less rushed, and The setup needs patience.
Discussion
FAQ
Prop
Forex
Indices
Commodities
Crypto
Stocks
Products available through cTrader Store, including trading bots, indicators and plugins, are provided by third-party developers and made available for informational and technical access purposes only. cTrader Store is not a broker and does not provide investment advice, personal recommendations or any guarantee of future performance.


!["[Hamster-Coder] Moving Average MTF" logo](https://cdn.ctrader.com/image/webp/b11b98b1-194d-4b8e-b00e-d611826ad159_31226)


Price
Since 05/01/2025
14
Sales