

Vwap Bands
Indicator
1 purchases
Version 1.0, Apr 2026
Windows, Mac
5.0
Reviews: 1
Trading product for Vwap Bands Indicator Moving Average VWAP, image 2
Trading product for Vwap Bands Indicator Moving Average VWAP, image 3
Trading product for Vwap Bands Indicator Moving Average VWAP, image 4
Trading product for Vwap Bands Indicator Moving Average VWAP, image 5
Since 14/02/2025
10
Sales

Description

Institutional VWAP Suite with Standard Deviation Bands

Trade where the institutions trade. The Institutional VWAP Suite provides the most accurate "Fair Value" benchmark for any intraday session, used by hedge funds and algorithmic desks globally.


The Benchmark of Institutional Trading

VWAP is not just another indicator; it is the average price a security has traded at throughout the day, based on both volume and price. It is the primary tool used by large-scale traders to determine entry efficiency. This suite enhances the standard VWAP by adding Volatility Bands (Standard Deviation), allowing you to identify overbought and oversold conditions with mathematical precision.


Key Features

    • Dynamic Intraday Anchoring: Choose to reset the calculation at the start of the day or at a Custom Session Time (e.g., London or New York Open) to align with specific market liquidity.
    • Multi-Tiered Volatility Bands:
      • Band 1 (1 Standard Deviation): Captures roughly 68% of price action—ideal for trend-following and pullbacks.
      • Band 2 (2 Standard Deviations): Captures 95% of price action—perfect for identifying major market exhaustion and reversal points.
    • True Institutional Logic: Unlike standard moving averages, this uses Cumulative Tick Volume, ensuring that heavy trading activity carries more weight than low-volume noise.
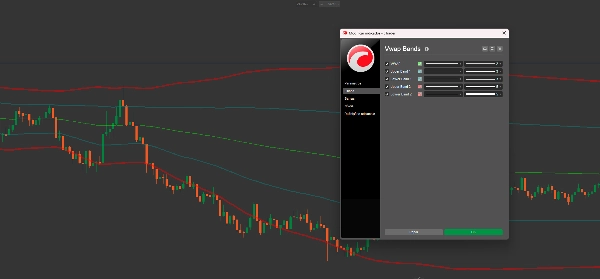
    • Clean Visual Hierarchy: Features a Gold VWAP "Basics" line with color-coded deviation bands for instant chart readability.
    • Universal Compatibility: Essential for trading Indices (DAX, NASDAQ), Forex, and Commodities where volume-weighted price is king.


Trading Strategy

    • The Pullback: In a trending market, look for the price to return to the Gold VWAP line for high-probability entries in the direction of the trend.
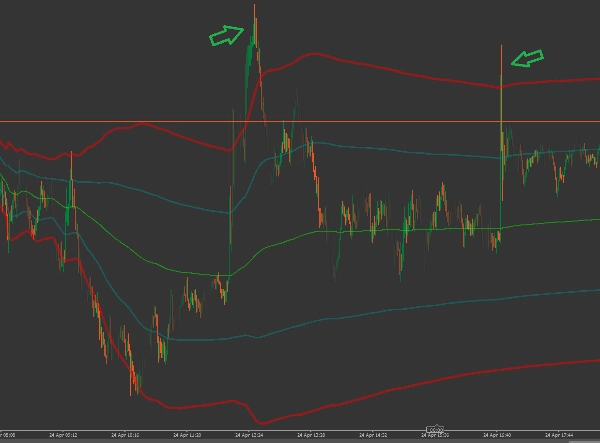
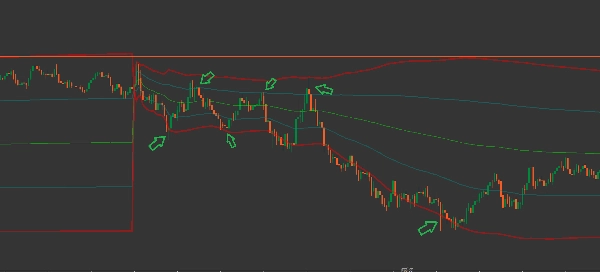
    • The Mean Reversion: When price touches or exceeds the Red Dotted Bands (Upper/Lower Band 2), it is statistically overextended. Look for reversals back toward the VWAP.
    • Session Start: Set the Start Time to "08:00" or "09:00" to capture the specific volume profile of the European or US market open.


Parameters

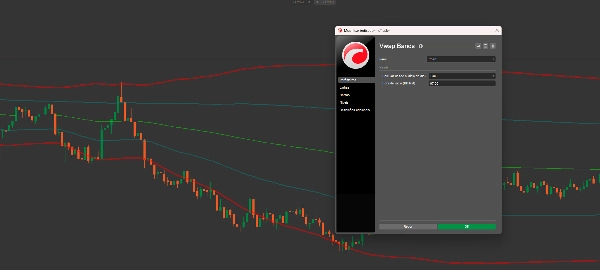
    • Calculate from Start of Day: Toggle between a standard 00:00 reset or a manual time reset.
    • Start Time (HH:MM): Define exactly when your "trading day" begins (e.g., 08:00 for London Open).
    • Visual Styles: Fully adjustable line thickness and styles for the VWAP and all 4 deviation bands.


Why You Need This Suite

If you are trading without VWAP, you are missing the "Value Area." This indicator tells you if you are buying at a premium or a discount relative to the rest of the market. It is the single most important tool for intraday traders looking to professionalize their setup.

Align your strategy with the "Big Fish." Add the Institutional VWAP Suite to your cTrader charts today.

Summary

AI summary
Vwap Bands is an institutional-grade intraday trading indicator that combines the Volume Weighted Average Price (VWAP) with multi-tiered standard deviation bands to provide a precise "fair value" benchmark. VWAP calculates the average price of a security weighted by volume throughout the trading day, serving as a key reference for large-scale traders to assess entry efficiency.
This suite enhances standard VWAP by adding two volatility bands: Band 1 (1 standard deviation) captures about 68% of price action, useful for trend-following and pullbacks; Band 2 (2 standard deviations) covers 95% of price action, highlighting potential market exhaustion and reversal points. The calculation uses cumulative tick volume, emphasizing heavy trading activity over low-volume noise.
Key features include dynamic intraday anchoring with customizable session start times (e.g., London or New York open), a clear visual hierarchy with a gold VWAP line and color-coded deviation bands, and universal compatibility across indices (DAX, NASDAQ), Forex, and commodities markets.
Traders can apply strategies such as entering on pullbacks to the VWAP line, identifying mean reversion when price touches outer bands, and aligning session start times to capture specific market volume profiles. Visual styles and calculation parameters are fully adjustable to fit individual trading preferences.
Indicator profile
Indicator category
Support & resistance
Output type
Visualisation
Filter
Data requirements
Bars only
Supported signals
Cross
Reversal
Trend strength
Volatility
Level touch
Level break
Session opening range
Breakout

Customer reviews

5.0
Reviews: 1
5
100 %
4
0 %
3
0 %
2
0 %
1
0 %
Customer reviews
April 28, 2026
Works better when the trader stays patient.

Discussion

FAQ

Moving Average
VWAP
Products available through cTrader Store, including trading bots, indicators and plugins, are provided by third-party developers and made available for informational and technical access purposes only. cTrader Store is not a broker and does not provide investment advice, personal recommendations or any guarantee of future performance.

More from this author

Indicator
ATR
Key Levels
It combines the trend-filtering power of Renko charts with the volatility tracking of ATR Bands
Indicator
ATR
RSI
+5
Delta RSI Candle Pro, the indicator that transforms ordinary candlesticks into powerful momentum visualizers.
Indicator
Volume
Order Block
+1
Elevate your market analysis with the Aggression Delta Volume Profile, a premium, institutional-grade order flow utility
Indicator
ATR
Volume
+4
This allows traders to see not just the trend, but whether the momentum itself is overextended.
Indicator
ATR
SMC
+5
Candles Volume Delta is a powerful, visually intuitive indicator that transforms raw tick volume into actionable trading
Indicator
ATR
Channel
+5
This fifth indicator is highly visual and focused on Supply and Demand zones
Indicator
ATR
VWAP
+2
Volume-Weighted Trend System that combines VWMA with ATR for volatility filtering.
Indicator
Channel
Moving Average
+2
This is a high-quality implementation of the Squeeze Momentum Candle logic applied directly to candle coloring.

You may also like

Indicator
SMC
Prop
+13
Institutional FVG detection with HTF projection, precise volume deltas, and smart fill logic.
Indicator
Key Levels
Liquidity Grab
+3
Visual market context dashboard showing bias states, CE positioning, session status and sweep context.
Indicator
ATR
RSI
+3
🚀 Specialized algorithm is designed to confirm entry and exit points with precision 🎯
Indicator
BOS
CHOCH
+5
Smart Money Concepts Automate your institutional analysis and make decisions with pinpoint precision..
Indicator
Forex
EURUSD
+4
Check the correlations between dozens of assets in one elegant display.
Indicator
Forex
Signal
+4
Gann Pivot Vision is an innovative analytical tool that combines classic pivot reversal levels and Gann geometry
Indicator
ATR
BOS
+3
Fair Value Gaps with Multi-Timeframe.
Indicator
Forex
BTCUSD
+11
Unlock trading precision with QQE! Dual QQE indicators with a Bollinger Bands zero line provide clear buy/sell signals.
Indicator
Color-Based Market Pressure & Volatility Visualizer The Kandika Heatmap Indicator
Indicator
ATR
SMC
+2
HTF POWER 3 ICT Power of 3 · M1 Precision · H4 Intelligence Auto-detect Accumulation → Manipulation → Distribution
Indicator
Forex
BTCUSD
+12
🎯Automatically identifies the market's significant turning points (key H & L) and draws dynamic support and.....✍️
Indicator
BOS
MSS
+3
Orderblocks with Multi-Timeframe.
Indicator
ATR
MACD
+15
Professional trading indicator: 5 cloud types, 9 ML engines, SMC Order Blocks, Pandas-TA & live dashboard.
Indicator
Forex
Crypto
+3
Detect powerful 2-candle reversal patterns at key highs/lows. Boost entries with real-time alerts and visual signals.
Indicator
Prop
Forex
+11
Ultimate Session Tool: Boxes, OR, KZs, PD Levels, Overlaps, Custom Lines & Names, Info Panel! Highly customizable 📉📈
Indicator
BOS
MSS
+3
Maps BOS, CHoCH, swing breaks and market structure shifts directly on your cTrader chart.
Indicator
Forex
Alerts you when price touches Fibonacci levels. Stay organized and trade efficiently!
Indicator
Forex
Crypto
+3
Consecutive Series Moves — Reveal the True Pulse of Price Action

Price

Since 14/02/2025
10
Sales
























