

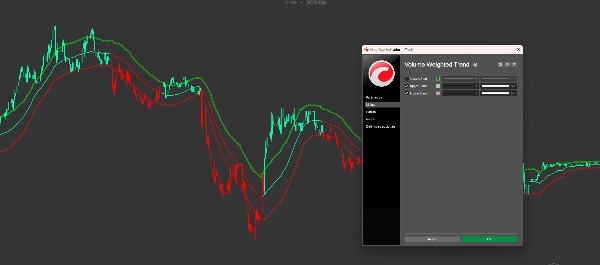
Volume Weighted Trend
Indicator
Version 1.0, Apr 2026
Windows, Mac
4.5
Reviews: 2
Trading product for Volume Weighted Trend Indicator Channel ATR, image 2
Trading product for Volume Weighted Trend Indicator Channel ATR, image 3
Trading product for Volume Weighted Trend Indicator Channel ATR, image 4
Trading product for Volume Weighted Trend Indicator Channel ATR, image 5
Trading product for Volume Weighted Trend Indicator Channel ATR, image 6
Since 14/02/2025
10
Sales

Description

Volume-Weighted Trend

This indicator trade with the smart money, combining volume-weighted accuracy with volatility-adjusted channels to provide the ultimate trend-following experience on cTrader.


The Power of VWMA & ATR Combined

Most trend indicators fail because they ignore Volume, the Volume-Weighted Trend calculates the market's true "center of gravity" by weighting price action against tick volume, by wrapping this logic in an ATR (Average True Range) envelope, the indicator filters out market noise and only signals a trend change when price momentum is strong enough to break through volatility barriers.


Key Features:

    • Volume-Weighted Precision: Uses VWMA to ensure the trend reflects where the actual trading activity is happening.
    • Volatility-Adjusted Channels: Integrated ATR bands act as dynamic support/resistance and trend triggers.
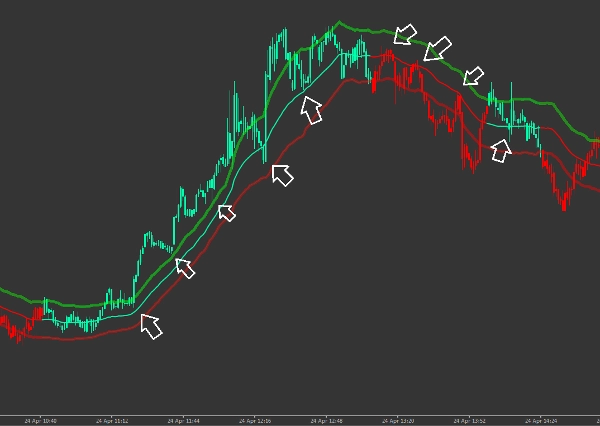
    • Smart Bar Coloring: Real-time candle coloring (Bullish/Bearish) for instant visual bias confirmation.
    • Pre-Built Performance Presets: Default: Balanced for most trading styles.
    • Fast Response: Optimized for scalping and quick entries.
    • Smooth Trend: Optimized for swing trading and long-term trend following.
    • Premium Visual Schemes: Includes 5 professional color presets (Classic, Aqua, Cosmic, Cyber, Neon) plus a fully Customizable Mode to match your workspace.
    • Dynamic Drawing: Uses advanced cTrader DrawTrendLine logic for smooth, high-performance rendering.


Trading Strategy:

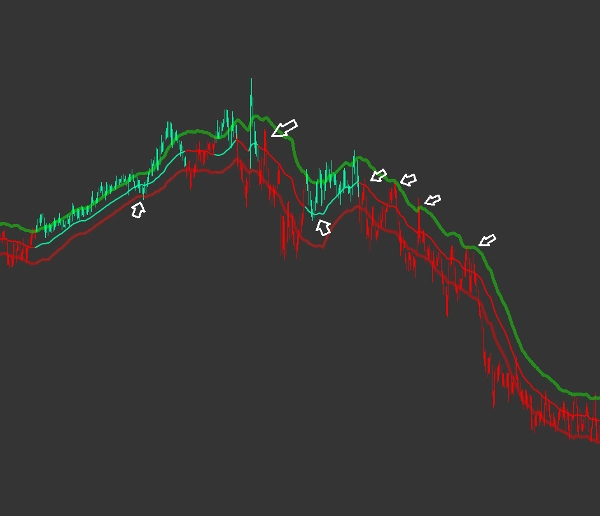
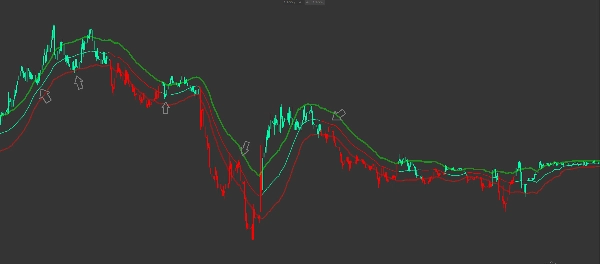
    • Bullish Trend: Triggered when price closes above the Upper ATR Band. The system turns Green/Cyan, indicating a high-probability long bias, when a pullback to the lines occurs along with reversal signals, enter as indicated by the arrows in the image below.
    • Bearish Trend: Triggered when price closes below the Lower ATR Band. The system turns Red, indicating a high-probability short bias, when a pullback to the lines occurs along with reversal signals, enter as indicated by the arrows in the image below.
    • Exit/Reversal: Use the median VWMA line as a trailing stop or exit when the color flips to the opposing trend, or use the previous high as a target or a 1:2 R:W.


Parameters

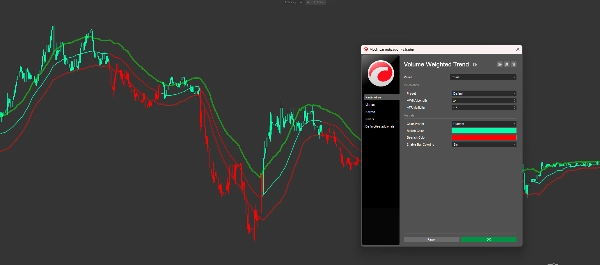
    • Preset Configuration: Quickly switch between Fast, Default, or Smooth calculation modes.
    • VWMA Length: Customize the look-back period for the volume-weighted average.
    • ATR Multiplier: Adjust the "tightness" of the channel to filter more or less market noise.
    • Visual Controls: Enable/Disable bar coloring and choose between multiple aesthetic themes.


Why Choose This Indicator?

Unlike standard Moving Averages that are often "late" to the move, the Volume-Weighted Trend reacts faster during high-volume breakouts and stays stable during low-volume choppy markets, it is a complete visual framework for any professional.


Stop guessing the trend, let Volume-Weighted Trend show you the way.

Summary

AI summary
Volume Weighted Trend is a trend-following indicator for cTrader that integrates volume and volatility to identify market trends with enhanced precision. It combines the Volume Weighted Moving Average (VWMA) to weight price action by tick volume, reflecting the true market "center of gravity," with an Average True Range (ATR) envelope that filters out market noise by adjusting for volatility. This dual approach signals trend changes only when price momentum surpasses dynamic volatility thresholds.
Key features include volume-weighted accuracy, ATR-based dynamic support and resistance channels, real-time bullish/bearish candle coloring for visual bias confirmation, and multiple pre-built presets optimized for scalping, swing trading, and long-term trend following. The indicator offers five professional color schemes plus a customizable mode and uses advanced drawing logic for smooth, high-performance trend line rendering.
Trading signals are generated when price closes above or below the ATR bands, indicating bullish or bearish trends respectively, with entry points on pullbacks confirmed by reversal signals. Exits or reversals can be managed using the median VWMA line or previous highs as targets.
Parameters allow customization of VWMA length, ATR multiplier for channel tightness, visual controls, and preset modes for fast, balanced, or smooth responses. This indicator supports visualization and filtering outputs and requires bar and volume data.
Indicator profile
Indicator category
Trend
Output type
Visualisation
Filter
Data requirements
Bars only
Volume
Supported signals
Cross
Breakout
Reversal
Trend strength
Level touch

Customer reviews

4.5
Reviews: 2
5
50 %
4
50 %
3
0 %
2
0 %
1
0 %
Customer reviews
April 28, 2026
The trader has a reason to slow down, but human context still matters here.
April 27, 2026
Kinda useful when the chart is messy. Bad settings can ruin the idea.

Discussion

FAQ

Channel
ATR
Moving Average
VWAP
Products available through cTrader Store, including trading bots, indicators and plugins, are provided by third-party developers and made available for informational and technical access purposes only. cTrader Store is not a broker and does not provide investment advice, personal recommendations or any guarantee of future performance.

More from this author

Indicator
ATR
Key Levels
It combines the trend-filtering power of Renko charts with the volatility tracking of ATR Bands
Indicator
ATR
RSI
+5
Delta RSI Candle Pro, the indicator that transforms ordinary candlesticks into powerful momentum visualizers.
Indicator
Volume
Order Block
+1
Elevate your market analysis with the Aggression Delta Volume Profile, a premium, institutional-grade order flow utility
Indicator
ATR
Volume
+4
This allows traders to see not just the trend, but whether the momentum itself is overextended.
Indicator
VWAP
Moving Average
Vwap Bands it is highly sought after by professional traders because it includes Standard Deviation Bands
Indicator
ATR
SMC
+5
Candles Volume Delta is a powerful, visually intuitive indicator that transforms raw tick volume into actionable trading
Indicator
Channel
Moving Average
+2
This is a high-quality implementation of the Squeeze Momentum Candle logic applied directly to candle coloring.
Indicator
ATR
Channel
+5
This fifth indicator is highly visual and focused on Supply and Demand zones

You may also like

Indicator
MSS
Key Levels
+4
Maps session ranges, previous highs/lows, equilibrium and premium/discount zones on your cTrader chart.
Indicator
Forex
BTCUSD
+4
The Linear Regression Oscillator (LRO) is a technical indicator based on linear regression analysis.
Indicator
MACD
Key Levels
+2
Trend indicator with multi-timeframe filters, generating signals only on fully completed bricks & candles. No Repaint.
Indicator
Key Levels
Liquidity Grab
+3
Visual market context dashboard showing bias states, CE positioning, session status and sweep context.
Indicator
SMC
Prop
+15
Automatic Elliott Wave Detection with Professional Filters
Indicator
Prop
Forex
+11
⚡Nebula Range Filter is a professional trend filter indicator for cTrader⚡
Indicator
BOS
MSS
+3
Orderblocks with Multi-Timeframe.
Indicator
Prop
Forex
NEW - PNLs as % - daily, weekly, monthly, or yearly & Spread, Time To Close, PNL Alerts, custom Bid / Ask lines
Indicator
ATR
RSI
+5
Advanced Anchored VWAP for cTrader: volatility bands, real‑time alerts & customizable session resets.
Indicator
AI
ATR
+27
Trade the Trend Flip. Control the Risk. 🎯📈”
Indicator
Fisher Transform with smoothing. Spot reversals and cycles with precision. Great for any market, any timeframe.
Indicator
Prop
Forex
+9
Trend Sniper — session-based tool highlighting live session ranges and adaptive Custom line.
Indicator
ATR
Engulfing
+5
This indicator maps D1, H4, H1 and 15M Multi-Timeframe Bias and Fresh High Probability Supply and Demand zones
Indicator
BOS
MSS
+3
Maps BOS, CHoCH, swing breaks and market structure shifts directly on your cTrader chart.
Indicator
AI
ATR
+26
Liquidity Cluster Order automatically detects and draws accumulation zones & distribution zones
Indicator
ATR
BOS
+3
Fair Value Gaps with Multi-Timeframe.
Indicator
It draws a step line that visualize the movement of H4. Particularly effective when trade on lower timeframe.
Indicator
Signal
This Fair Value Gap (FVG) indicator is a technical analysis on multi-timeframe.

Price

Since 14/02/2025
10
Sales
























