Brokers & props
For business
00
Days
:
00
Hours
:
00
Minutes
:
00
Seconds
LT_FairValueGap
Indicator
1 purchases
Version 1.0, Jun 2025
Windows, Mac
Since 25/09/2024
Sales
28
"LT_FairValueGap" uploaded image

Note: Tested on cTrader Windows only.

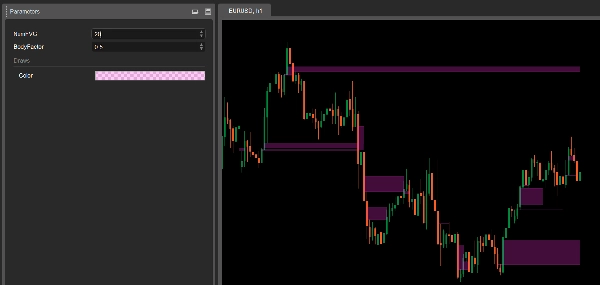
LT_FairValueGap is a lightweight and powerful Fair Value Gap indicator designed for precision price action traders. It highlights institutional-style imbalance zones using a strict 3-bar logic and removes them once price revisits the gap — giving you clean, actionable zones for entries, exits, or confluence.

🔍 How It Works

  • A Fair Value Gap (FVG) is identified when a strong middle candle (with large body) creates an imbalance between two adjacent candles.
  • The gap is marked as a temporary support/resistance zone (SR).
  • Once price returns and fills the gap, the zone no longer extended— ensuring charts remain uncluttered and relevant.

⚙️ Parameters

  • NumFVG: Maximum number of FVG zones to show on chart.
  • BodyFactor: Strength threshold for the middle bar (default: 2.0× average body of the last 20 bars).

Key Features

  • Institutional-style gap detection (3-bar logic)
  • Clean charting — zones stop extending once hit
  • Adjustable sensitivity via BodyFactor
  • Plug-and-play: minimal configuration

📌 Use Cases

  • Identify institutional imbalances and reaction zones
  • Use as entry confluence or invalidation marker
  • Combine with swing structure or volume tools

Whether you're trading breakouts, mitigations, or reversals, LT_FairValueGap helps you spot the true imbalance zones that matter — without the noise.

0.0
Reviews: 0
Customer reviews
No reviews for this product yet. Already tried it? Be the first to tell others!
Forex

More from this author

LT Flexible Volume Profile
Flexible Volume Profile, designed with performance in mind.
cBot
ATR
LT_RiskGuardian
Auto-manages SL, TP, and position size to enforce risk discipline. Never enter a trade without a plan again.
Indicator
Breakout
ATR
LT_SmartSwings
Detects swing highs/lows, structure, breakouts, trend lines, and fibs — great for price action trading.
Indicator
Indices
Commodities
ATR
+4
LT_Ind_Candles
Most used candle patterns. (1 candle, 2 candles and 3 candles patterns) and Marubozu. Bonus Fibo Risk control.
Indicator
Indices
Prop
Stocks
+3
LT_Ind_SRZones
Automatic Support/Resistance zones from swing points.
Indicator
VWAP
Indices
Prop
+4
LT_Ind_VWAP
Multi-anchor VWAP indicator for cTrader. Plots two VWAP lines (red and blue) with selectable anchors.
Indicator
Indices
Prop
Commodities
+3
LT_Ind_Pivot
Draws pivots (P, S/R, CPR) from selected anchors like H1–Month1, with optional mid-levels (PS1, S1S2, etc.)
Indicator
Indices
Prop
Commodities
+3
LT_Ind_TradeNet
Personal trade tracker for a single symbol. Clear net profit summary — FreshNet, ManageNet, DayNet, WTDNet, MTDNet.

You may also like

Repiptor Candlescope Lite
Candlestick pattern detector lite version
Indicator
Grid
NAS100
NZDUSD
+17
Order Flow
Volumen Delta", es una representación visual del flujo de órdenes basada en el volumen de transacciones.
Indicator
NAS100
NZDUSD
Breakout
+11
Previous day Key Levels
Previous day key levels indicator
Indicator
NAS100
XAUUSD
FVG
+6
Simple Smart Money Concepts
Simple Smart Money Concepts (SMC)
Indicator
Stocks
Forex
Crypto
+1
Market Structure SNR + Auto Bias
Market Structure Indicator – Your Trading Map in a Noisy Market. No more Panicking Which one, Where, Why and How.
HTFBB
Plot higher-timeframe Bollinger Bands for clearer structure, pullback zones, and breakout signals—without switching char
Indicator
Indices
RSI
Signal
[Stellar Strategies] MARSI Signal Plotter
🚀📈 Plot buy/sell signals on Range Bars using Moving Averages and RSI. Clear, actionable trading insights.🚀📈
Indicator
Indices
Prop
Stocks
+3
Market Sessions Advanced
Advanced Market Sessions with ICT killzones
Indicator
Indices
Stocks
Commodities
+2
Tracking Performance by Quantara
PnL dashboard with per‑asset exposure, win‑rate, and spread % with dynamic colors.
Indicator
NAS100
Indices
Prop
+6
ICT_SMC_ToolKit
institutional-level market analysis
Indicator
RSI
Breakout
XAUUSD
+4
Dynamic Market Structure Analysis of Turning Points
Identify market structure effortlessly with swing highs, lows, CHoCH, and BOS levels for smart trading decisions! 📊🔍"
Indicator
NAS100
NZDUSD
XAUUSD
+11
HKTrading Free ZigZag
Lightweight ZigZag tool for clear structure, swing highs/lows and liquidity-based analysis.