
LT Flexible Volume Profile
Indicator
12 purchases
Version 1.0, Sep 2024
Windows, Mac
5.0
Reviews: 3
Note: Tested on cTrader Windows only.
Volume Profile
A vertical profile drawing in the price chart to show at which price there are more/less volume (trading interest).
The Flexible Volume Profile indicator
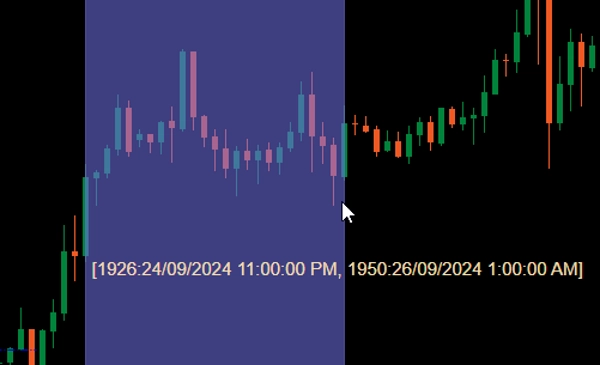
When added to your chart, Ctrl drag the left mouse on an area in the price chart to have profile drawn for that area.
For performance sake, the profile will be drawn in 2 states:
- Coarse profile: The indicator will use the timeframe defined by CoarseTF (default m5) to load for volume information, this usually fast. While Coarse profile is shown, the Fine profile will be loaded under ground.
- Fine profile: More precise profile, which use the timeframe defined by FineTF (default m1), but you can have it set to finest (t1 - single tick). However, if you are viewing Daily or longer TimeFrame chart, setting to ticks timeframe will increase the loading time.
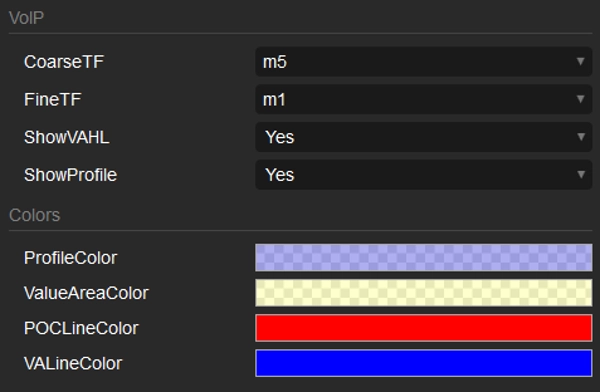
Parameters
- CoarseTF: Timeframe for Coarse data (default m5).
- FineTF: Timeframe for Fine data (default m1).
- ShowVAHL: Shows the VAH (Value Area High) and VAL (Value Area Low).
- ShowProfile: If Yes then showing the full profile, otherwise just show VAH, VAL and POC (Point of Control).
- Colors: Color customization.
How to use
After adding the indicator to your price chart, use a Ctrl left mouse drag to select the region in the chart that you would like to profile and that's it.
After the profile is rendered, you will see some information/manipulation at the bottom of the profile:
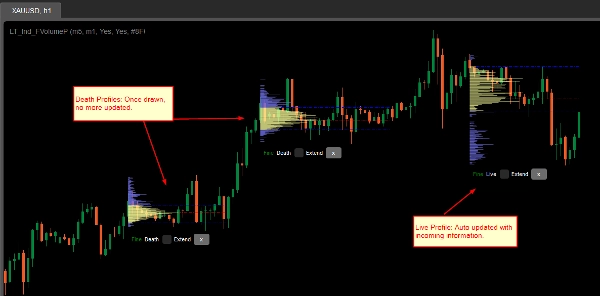
- Coarse/Fine: status of the profile.
- Death/Live: if your profile covers the latest bar (candle), then it is a Live profile and automatically updated with incoming information.
- Extend checkbox: check to have VAH, VAL and POC lines extend to the latest bar (candle)
- x button: Click to remove the profile from the chart.
Indicator profile
5.0
Reviews: 3
5 | 100 % | |
4 | 0 % | |
3 | 0 % | |
2 | 0 % | |
1 | 0 % |
Customer reviews
October 1, 2024
Sensible product to test around volume based context. The useful part is checking participation, value areas and pressure, with the numbers checked before scaling. I would review 20 reactions near POC or VWAP before trusting the read. The data helps most when price action confirms the same zone.
September 30, 2024
September 30, 2024
Good tool for patience if the trader wants it adds useful information behind the price move. It works best as support, not a final decision maker. Volume context is stronger when POC, VWAP and value area agree across 2 sessions. volume alone can be noisy without price action.
Forex
Products available through cTrader Store, including trading bots, indicators and plugins, are provided by third-party developers and made available for informational and technical access purposes only. cTrader Store is not a broker and does not provide investment advice, personal recommendations or any guarantee of future performance.


Since 25/09/2024
34
Sales