
Description
✅ High-Volume Support & Resistance Boxes — automatically maps real “defend / break” zones
✅ Volume-Weighted Zone Strength (dynamic opacity) — stronger volume = stronger box presence
✅ Pivot-Based Zone Creation (Lookback) — only confirmed levels become zones (less noise)
✅ Adaptive Box Width (ATR-based) — zones scale to current volatility, not fixed guesses
✅ Live Box Extension — zones keep projecting forward as price evolves
✅ Break / Hold Intelligence — detects when a zone holds vs. breaks and instantly reacts
✅ Visual Event Marks (Diamonds) — clean “hold / flip” confirmations without overthinking
✅ Break Labels — clear “Break Sup / Break Res” events on-chart
✅ Full Visual Control — toggles for Boxes / Volume Text / Diamonds / Break Labels
✅ Auto-Clean System — prevents chart clutter by automatically removing old event marks
✅ Max Boxes Control — hard limit to keep performance fast and charts readable
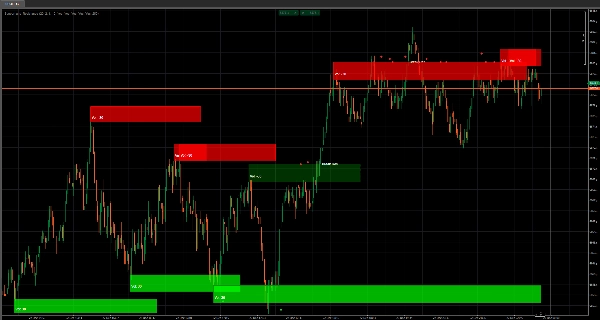
Support & Resistance (High Volume Boxes) is not a basic S/R tool that spits out random lines.
This indicator is built to show you something far more valuable:
Where price created real interest — and where it is most likely to react again.
Instead of drawing “pretty levels,” it builds high-volume supply & demand zones as boxes directly on your chart, so you can trade structure like a professional:
identify the zone → watch the reaction → trade the hold or the break.
The Core Advantage: Volume + Structure, not guessing
Every box is created only when two conditions align:
- A confirmed pivot (structure matters)
- A volume extreme (interest matters)
That means you’re not getting spammed with weak zones.
You get fewer zones — but the ones you do get are the zones that actually matter.
Strength You Can See (Opacity = Power)
This is where it becomes unfair for people who trade “blind” S/R.
Box fill opacity scales with volume, so you instantly know:
- Faint box = light interest (watch it)
- Strong box = heavy interest (respect it)
No extra indicators, no interpretation gymnastics — it’s literally visible.
Volatility-Adaptive Zones (ATR Width)
Markets don’t move the same every day.
This indicator adapts box thickness using a long ATR baseline, so zones expand or tighten with volatility.
Result:
zones stay realistic instead of being too thin to matter or so wide they’re useless.
Hold vs Break Intelligence (and Instant Visual Feedback)
A zone is only valuable if you can read what price is doing with it.
This indicator tracks:
- Holds (rejection / respect)
- Breakouts (acceptance through the zone)
…and then updates the styling live:
- Holds keep the original “support/resistance identity”
- Breaks flip behavior (support can become resistance and vice versa)
- Break styling can switch to dashed + new color tone so you know instantly:
“This level just changed character.”
Diamonds + Break Labels: Clean decision triggers
You get simple, high-signal event markers:
- Diamonds to highlight hold/flip events
- Break labels so you never miss the moment a level snaps
It’s the difference between thinking something broke… and knowing it broke.
Built for Real Trading: Control + Clean Charts
This indicator was designed to stay usable after hours of trading:
- Want only zones? Turn off diamonds/labels.
- Want pure signals? Turn off volume text.
- Want performance? Limit Max Boxes.
- Hate clutter? Auto-Clean Events keeps the chart sharp by removing old marks automatically.
You stay focused on the current battle — not drowned in history.
Recommended Setup (Quick Start)
✅ Lookback Period: 20 (balanced confirmation)
✅ Vol Filter Length: 2 (responsive)
✅ Box Width Mult: 1.0 (neutral)
✅ Show Boxes: ON
✅ Diamonds + Break Labels: ON (until you learn the behavior, then refine)
✅ Auto-Clean Events: ON (keep it clean)
What this indicator really gives you
A visual map of where the market showed its hand — and a live read on whether price is respecting that zone or destroying it.
If you trade breakouts, pullbacks, reversals, or retests:
this becomes your “battlefield overlay.”
Summary
The indicator adapts box width based on average true range (ATR), ensuring zones scale with current market volatility. It continuously projects zones forward as price evolves, offering live updates on whether zones hold (support/resistance) or break (flip behavior). Visual markers such as diamonds and break labels signal hold and breakout events, enabling traders to quickly interpret market reactions without ambiguity.
Users can customize visual elements including boxes, volume text, event marks, and set limits on the number of boxes to maintain chart clarity and performance. An auto-clean system removes outdated event marks to prevent clutter. This tool supports trading across various markets including forex, indices, commodities, stocks, and cryptocurrencies, and is suitable for strategies involving breakouts, pullbacks, reversals, and retests.


!["[Stellar Strategies] MARSI Signal Plotter" logo](https://cdn.ctrader.com/image/webp/7b2b8da6-8f8e-4646-8d4a-4710c516c01e_25567)


