
Higher TimeFrame Candle Tracker
Indicator
1 purchases
Version 1.0, Oct 2025
Windows, Mac
Description
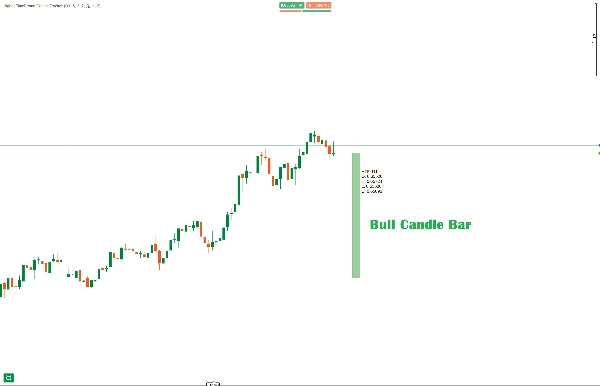
The Higher timeframe candle tracker is used to get a glimpse of what the selected higher time frame candle is like.
Key Features:
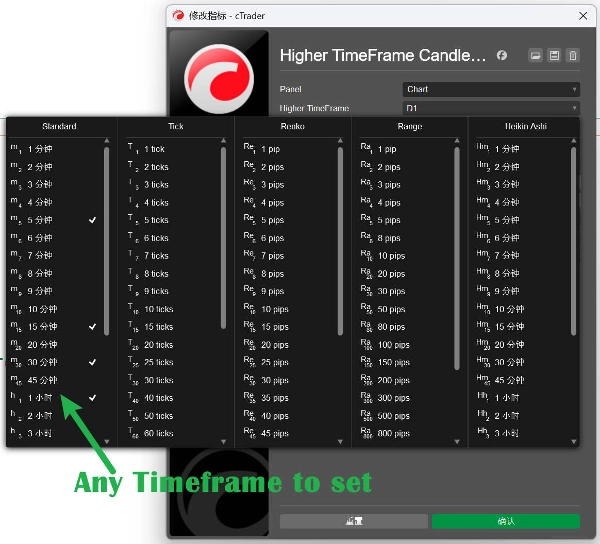
- Customizable Timeframe Selection - Choose any higher timeframe (Daily, Weekly, Monthly, etc.)
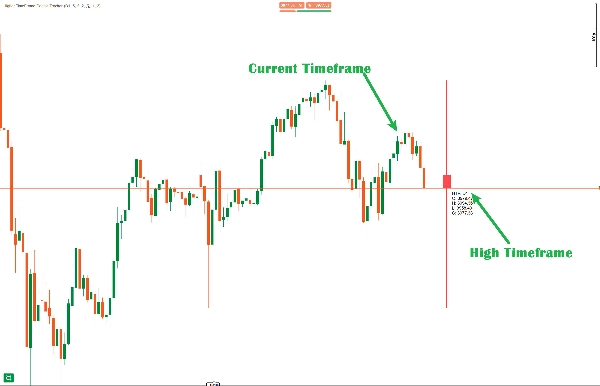
- Visual Candle Display - The current HTF candle is plotted with proper wicks and body, offset from the current price action
Adjustable Settings:
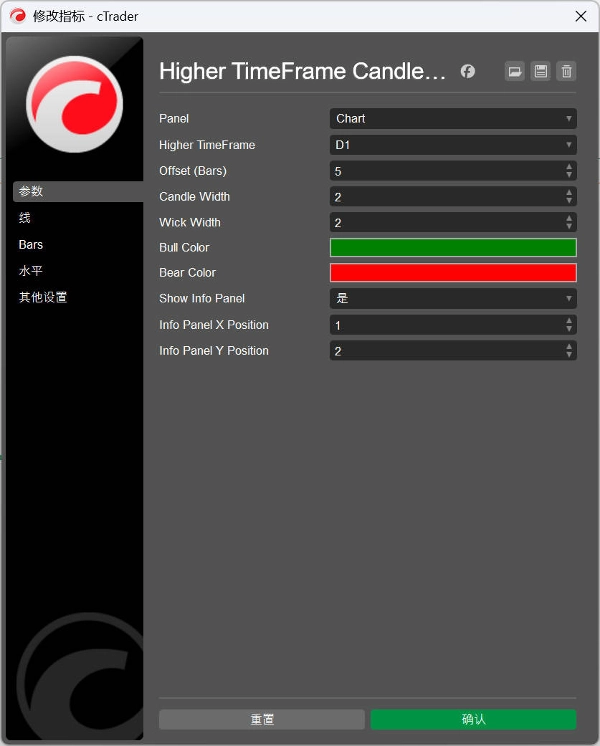
- Offset: Distance in bars from current price (default: 5)
- Candle Width: Thickness of the candle body (1-10, default: 3)
- Wick Width: Thickness of the wick lines (1-5, default: 1)
- Colors: Customizable bull (green) and bear (red) colors
Support TimeFrame:
- Minute, Minute2, Minute3, Minute4, Minute5
- Minute10, Minute15, Minute30, Minute45
- Hour, Hour4, Hour12
- Daily, Day2, Day3
- Weekly, Monthly
Information Table - Displays real-time HTF candle data: Open, High, Low, Close values.
中文说明:
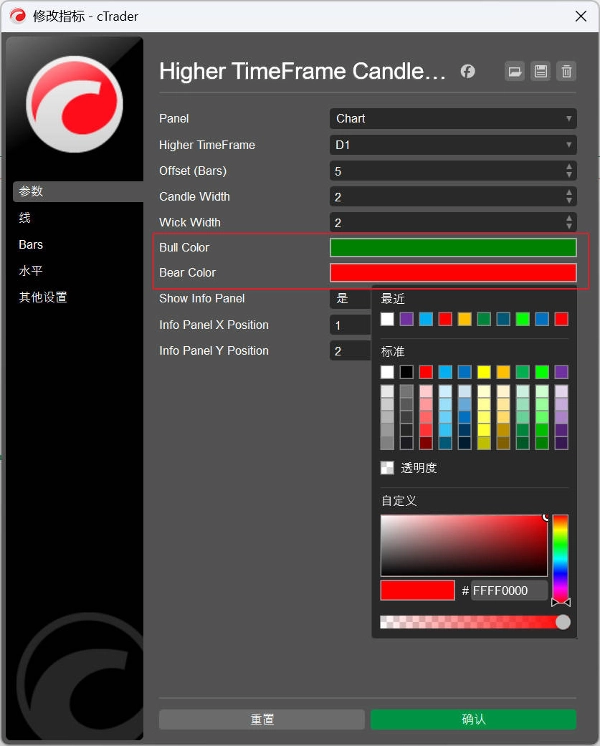
可自定义参数:
- Higher TimeFrame(高时间框架) - 选择要跟踪的时间框架(默认:Daily)
- Offset(偏移量) - K线距离当前价格的位置(默认:5根K线)
- Candle Width(K线宽度) - K线实体的宽度(1-10,默认:3)
- Wick Width(影线宽度) - 影线的宽度(1-5,默认:2)
- Bull Color(看涨颜色) - 看涨K线颜色(默认:Green)
- Bear Color(看跌颜色) - 看跌K线颜色(默认:Red)
- Show Info Panel(显示信息面板) - 是否显示HTF数据面板(默认:true)
核心特性:
- 实时HTF K线显示 - 在图表上绘制当前高时间框架K线
- 完整的K线结构 - 包含实体、上影线和下影线
- 颜色区分 - 自动根据涨跌使用不同颜色
- 信息面板 - 显示Open、High、Low、Close和方向指示
- 自适应填充 - 看涨K线半透明,看跌K线较深
支持的时间框架:
- Minute, Minute2, Minute3, Minute4, Minute5
- Minute10, Minute15, Minute30, Minute45
- Hour, Hour4, Hour12
- Daily, Day2, Day3
- Weekly, Monthly
Summary
Indicator profile
Customer reviews
0.0
Reviews: 0
Customer reviews
No reviews for this product yet. Already tried it? Be the first to tell others!
Discussion
FAQ
Prop
Forex
Breakout
Indices
Commodities
Crypto
Stocks
Products available through cTrader Store, including trading bots, indicators and plugins, are provided by third-party developers and made available for informational and technical access purposes only. cTrader Store is not a broker and does not provide investment advice, personal recommendations or any guarantee of future performance.


Price
Since 30/09/2024
44
Sales