"Sessions" logo
Sessions
"Sessions" uploaded image
Since 21/01/2026
2
Sales
63
Free installs

Sessions by [BeyondTrading] — Know where the market has been.

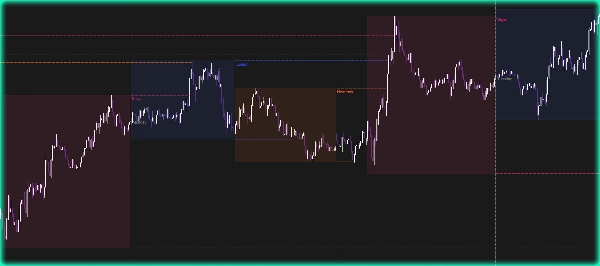
Visualize the 4 major trading sessions directly on your chart — New York, London, Tokyo, Sydney — fully customizable in color, time, and transparency. Each session draws a live range box that expands in real time as price moves, so you always know the range being built.

When a session closes, the High and the Low are automatically projected forward as dashed lines. These levels stay active until price breaks them — then they stop. No clutter, no guessing. You see exactly which levels are still live and which have been taken out.

Why session High/Low levels matter

Session highs and lows are major liquidity pools. Institutions and market makers consistently return to these levels to either reverse or grab liquidity before a real move. The previous London High is not just a line — it is where stop orders are sitting, where breakout traders are trapped, and where smart money comes hunting before reversing. With automatic extension and instant breakout detection, you always know which levels are still in play and likely to trigger a reaction.

Features

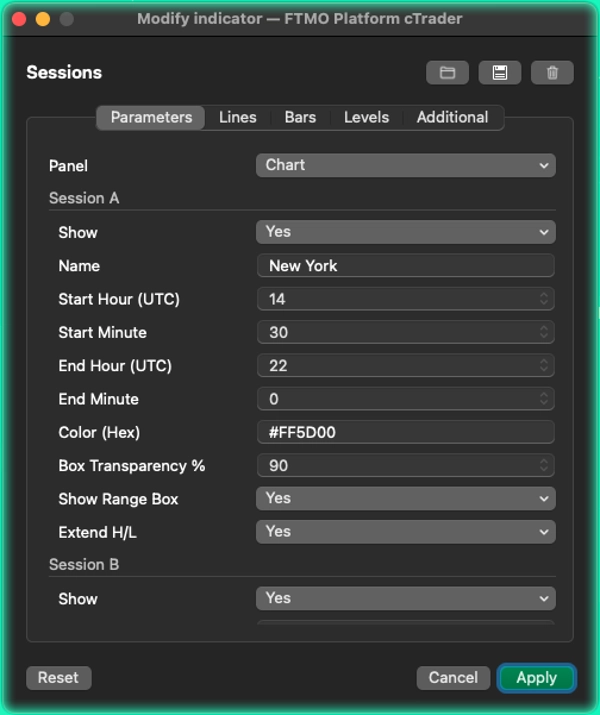
  • 4 fully configurable sessions with custom start/end time, hex color, and transparency.
  • Live range box that updates on every bar.
  • High and Low projected forward after session close, automatically removed on breakout.
  • Configurable max active levels to keep the chart clean.
  • Daily vertical divider with day-of-week label.
  • Works with overnight sessions like Sydney.


Indicator profile
0.0
Reviews: 0
Customer reviews
No reviews for this product yet. Already tried it? Be the first to tell others!
Prop
Forex
Breakout
Indices
Commodities
Crypto
Stocks
Products available through cTrader Store, including trading bots, indicators and plugins, are provided by third-party developers and made available for informational and technical access purposes only. cTrader Store is not a broker and does not provide investment advice, personal recommendations or any guarantee of future performance.

More from this author

Pivot-based Support and Resistance levels that extend until broken, with volume-confirmed break signals
Adaptive Entropy Trend reads market randomness to filter noise from direction. Smooth trend line, automatic bar coloring
Exhaustion Hunter by BeyondTrading — When price hits the limit, the reversal is next.
Multi EMA Timeframes lets you stay on your chart and see the exact EMA from any timeframe you choose — up to 5 at once.
Reads trend acceleration, not just direction. Glowing lead line, dynamic channel, auto flip levels.
ATR Ratio SuperTrend show Trend & volatility combined. Clean arrows, built-in Take Profit.
Asia, London & NY sessions mapped in real time, boxes, VWAP, kill zones, range extensions, and a built-in RSI panel.
Reversal Hunter by BeyondTrading — Stop guessing direction. Catch the turn before the crowd.

You may also like

Multi-timeframe heatmap scoring Direction, Strength & Volatility at a glance!
Killzone Session With VWAP – Precision Meets Price Action
🔮 Projects statistically probable future price paths using MC simulation and evaluates directional bias through a.....
The purpose of the algorithm of the Boxify indicator is to try to put price action into zones, or better, boxes.
Customizable window inside your platform, access to any website Calendar
This indicator works best as a trend-confirmation tool—wait for multiple signals!
🔹 Advanced RSI with smart alerts and visual signals for faster trend reversal detection.
28-method MA library in one indicator — from classic EMAs to adaptive & zero-lag variants.
New Trend whit buy-sell signal
Automated position sizing based on risk, entry, and stop loss with ATR support and visual trade setup on charts.
The QQE enhances the RSI by incorporating moving averages. This version includes fast and slow trailing levels.
High-probability trading signals in the fast-paced world of forex and CFD trading.
The indicator analyzes volume and calculates liquidity levels for that volume. Full trading system.
📊 Visualize market trends more clearly and dynamically
A volatility-adaptive trend-following indicator that dynamically adjusts to market conditions.
Bermaui Bands (BB) is a technical analysis tool that helps filter between ranging and trending price movements.
MultiTimeframe MA
The Floating Risk Indicator is an essential tool for traders who prioritize risk management.
Since 21/01/2026
2
Sales
63
Free installs