
Description
QX FrameForge is an overlay multi-timeframe market-state dashboard for cTrader. It compresses what is happening across several timeframes into a fast, readable panel, so you can trade with context instead of guessing.
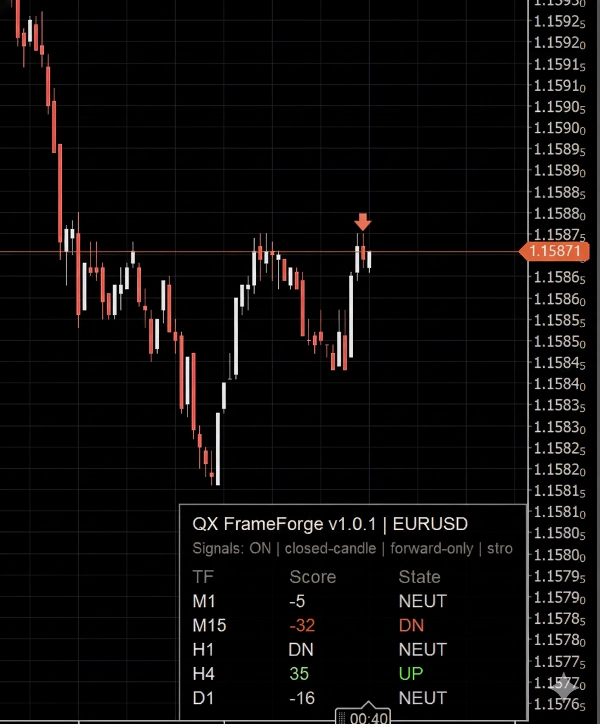
For each selected timeframe, the panel shows:
- TF (timeframe)
- Score (-100 to +100) to express direction and strength
- State: UP / NEUT / DN for quick decisions
Optional arrows can be enabled to mark confirmations using closed candles only, which keeps the chart stable and avoids intrabar flicker.
How to read it (beginner-friendly)
Think of the panel as a direction meter:
- Positive Score and UP means bullish conditions on that timeframe
- Negative Score and DN means bearish conditions on that timeframe
- NEUT means conditions are mixed, ranging, or not strong enough to be directional
A Neutral Zone setting controls how easily the indicator switches into NEUT. A wider neutral zone produces fewer directional states (more conservative).
What’s inside the Score (high-level)
The Score blends:
- a trend component (direction and slope behavior)
- a momentum component (strength of continuation vs hesitation)
- an optional volatility filter to reduce noisy periods
The result is a bounded score designed for multi-timeframe alignment, not for “magic entries”.
How traders typically use FrameForge
1) Multi-timeframe alignment
- Prefer trades when higher timeframes agree (example: H1 + H4 both UP)
- Use a lower timeframe (example: M5) for timing
2) Regime filtering
- Too many NEUT states usually means chop and lower quality conditions
- Mixed higher TF direction suggests caution or smaller exposure
3) Confirmation layer
- Use FrameForge to confirm that your setup is aligned before you commit
Optional arrows (signals)
Arrows are an optional visual helper. They are evaluated on the last closed candle only.
You can choose how arrows trigger:
- only when strength crosses a threshold,
- only when the directional state changes,
- or more frequently when conditions remain strong.
Controls are included for:
- strength threshold
- cooldown (minimum bars between arrows)
- one-signal-per-swing (reduces repeated arrows in the same direction)
- icon limit (prevents chart clutter)
Important: arrows are designed to be forward-only from the moment you enable them, to avoid historical object spam and misleading retroactive visuals.
Compatibility
- Works on any cTrader symbol and any chart timeframe
- Indicator only. No orders are placed.
- Optimized UI updates to keep charts responsive.
Risk disclaimer
Trading involves risk. Past performance does not guarantee future results.
Summary
The Score integrates trend direction and slope, momentum strength, and an optional volatility filter to reduce noise, producing a bounded metric aimed at multi-timeframe alignment rather than precise entry signals. Traders typically use FrameForge for aligning trades across timeframes (e.g., confirming higher timeframe trends before timing entries on lower timeframes), filtering market regimes by identifying choppy or mixed conditions, and adding a confirmation layer to their setups.
Arrow signals can be customized by strength thresholds, directional changes, cooldown periods, and icon limits to avoid chart clutter. The indicator works on any cTrader symbol and timeframe, updating efficiently to maintain chart responsiveness. It does not place orders and serves solely as a visual analytical tool.
Customer reviews
5 | 100 % | |
4 | 0 % | |
3 | 0 % | |
2 | 0 % | |
1 | 0 % |


