"QX PivotZones" logo
QX PivotZones
"QX PivotZones" uploaded image
34.45M
Traded volume
194.05K
Pips won
9
Sales
206
Free installs

QX PivotZones is a Pivot Points indicator built for real trading decisions, not just static lines that price ignores"


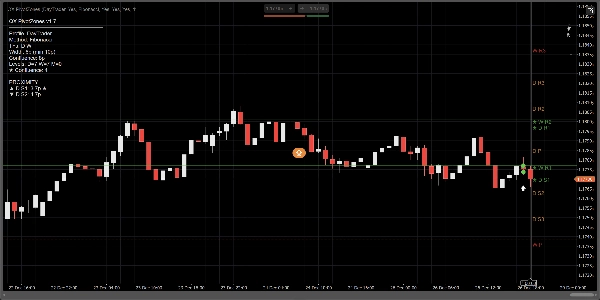
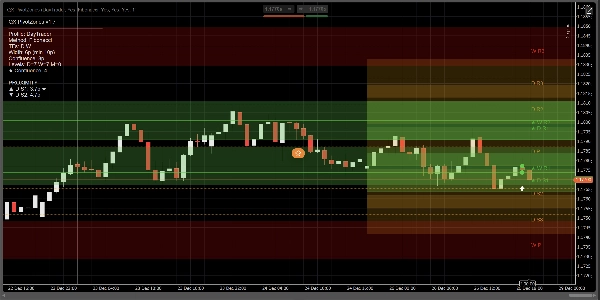
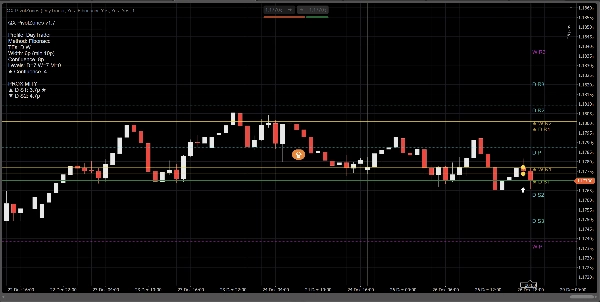
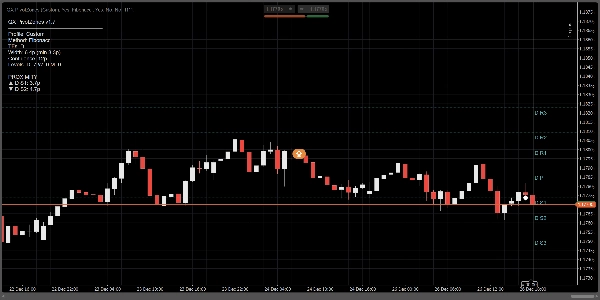
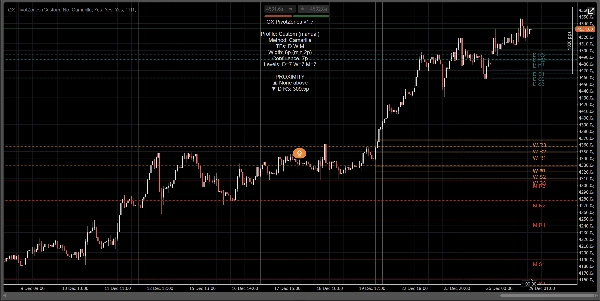
It calculates Daily, Weekly, and Monthly pivots using Classic, Fibonacci, Camarilla, or Woodie, and plots them as true price zones (bands) with adjustable width (Pips or ATR-based). The core edge is simple: it automatically highlights multi-timeframe confluence and turns pivots into actionable areas, not “perfect-line fantasies”.


Why it’s different from typical Fibonacci Pivot / FiboPoints tools:

Most “FiboPoints” indicators stop at basic pivot lines. QX PivotZones adds what traders actually need:

  • Automatic D/W/M Confluence Detection: when pivots from different timeframes cluster, the level is highlighted (★) and painted using the confluence color.
  • Zones (Bands) instead of thin lines: define width in pips or ATR. This reduces noise from “almost-touch” reactions.
  • Nearest Levels Filter (optional): show only the most relevant zones above and below current price.
  • Useful Alerts: trigger on Enter Zone, Touch Line, or Both, with cooldown and optional “Confluence Only” filtering.
  • Info Panel + Proximity: see enabled TFs, method, zone width, confluence count, and distance to nearest zone above/below.


How to use:

1) Pick a profile

  • Scalper: intraday, fewer levels, tighter adaptive zones.
  • DayTrader: Daily + Weekly (default).
  • Swing: Daily + Weekly + Monthly.
  • Custom: manual control of everything.

Tip: If you want “DayTrader + Monthly”, disable profile overrides (or use Custom) and enable Show Monthly manually.


2) Configure zones (the whole point)

Under Zone Width Mode:

  • Pips for fixed, consistent bands.
  • ATR for volatility-adaptive bands.

Key parameters:

  • Zone Width (pips) or ATR k
  • Min Zone Width (pips) to avoid bands becoming too thin
  • Fill Zones to paint the zones
  • Extend Zones Right to project bands into the visible right side


3) Enable Confluence (the main differentiator)

  • Highlight Confluence: ON
  • Confluence Mode:
    • Pips for fixed tolerance
    • ATR for adaptive tolerance
  • Confluence Distance or Confluence ATR k

Confluent levels get:

  • Confluence color
  • ★ marker on the label
  • Count shown in the panel


4) Alerts (trade without staring at the screen)

  • Alerts: EnterZone, TouchLine, or Both
  • Alerts: Confluence Only: reduces noise
  • Alert Cooldown (bars): prevents spam
  • Plot Alert Icons: marks events on the chart


Quick setup presets (suggested)

Scalping (M5–M15)

  • Zone Width Mode: ATR
  • ATR k: 0.15–0.25
  • Confluence Mode: Pips
  • Confluence Distance: 4–8 pips
  • Only Nearest Zones: ON (3 above / 3 below)


Day Trading (M15–H1)

  • Zone Width Mode: Pips
  • Width: 6–10 pips
  • Confluence: 8–12 pips
  • Enable Daily + Weekly


Swing (H4–D1)

  • Zone Width Mode: ATR
  • ATR k: 0.25–0.45
  • Enable Daily + Weekly + Monthly


What it does (and doesn’t)

  • This is not a buy/sell signal generator.
  • It is a market structure / S&R zone map with event alerts (enter/touch) and confluence highlighting.
  • Best use cases: reactions at pivots, rejection/acceptance, pullbacks, targets, scaling out, and trade protection.


Indicator profile
0.0
Reviews: 0
Customer reviews
No reviews for this product yet. Already tried it? Be the first to tell others!
Signal
Indices
Commodities
GBPUSD
MACD
Bollinger
Scalping
Supertrend
AI
XAUUSD
NAS100
BTCUSD
Forex
Breakout
RSI
EURUSD
NZDUSD
Fibonacci
VWAP
Prop
ZigZag
ATR
SMC
Crypto
Grid
Stocks
Fair Value Gap (FVG)
USDJPY
Products available through cTrader Store, including trading bots, indicators and plugins, are provided by third-party developers and made available for informational and technical access purposes only. cTrader Store is not a broker and does not provide investment advice, personal recommendations or any guarantee of future performance.

More from this author

Free educational Renko cBot made to help traders learn how Renko automation works and to showcase my development style.
Multi-timeframe heatmap scoring Direction, Strength & Volatility at a glance!
QX SessionBox ORB: Session boxes + ORB levels + clean dashboard with optional closed-candle breakout signals.
SMC without the mess: Clean structure + auto-managing FVGs + MTF panel. Hard-right-edge, step size-based for any symbol.
Multi-timeframe market-state dashboard: Score (-100..+100) + UP/NEUT/DN per TF, with optional closed-candle arrows.
Real-time multi-asset correlation matrix with 5 themes, Δ% performance tracking, and full customization. Up to 12 symbol
Candle pressure overlay for cTrader. Instantly read close strength, directional bias, and momentum quality.
Risk-first position sizing panel for indices and FX majors. Clean. Non-repainting. Built for real trading.
Liquidity sweeps without clutter. Equal highs/lows pools, sweeps + reclaim, filters + compact panel. StepSize-based.
Session Volume Profile + Composite. POC/VAH/VAL, Focus/Solo. Fast, clean, no ghosts, live-ready.
Learn candlestick patterns with live signals, objective rules, context notes, and an interactive quiz training mode.

You may also like

Catch High-Probability Reversals with Precision Swing
Trade fearlessly with an assistant that auto-adjusts order blocks, manages risks, and ensures precision for every trade
Boost your trading with Candlestick Patterns for cTrader – auto-detect key signals for smarter, faster decisions!
The Trend Angle Indicator provides a clear and intuitive way to visualize market trends.
Crossover Buy and Sell Alerts and signals
VmmSignalAverage PRO Trial - Professional Pattern Detection Indicator.
this indicator show other time frame close in lower time frame. for ex: show daily close in m 15.
Trend following signal
PnL dashboard with per‑asset exposure, win‑rate, and spread % with dynamic colors.
Hammer Pattern Indicator
The Matrix Trend Heatmap pro, Turn your chart into a real-time market mood board — instant trend direction.
Auto-swing detection driving 7 Fibonacci projections: retracement, expansion, fan, time, pitchfork, channel, Gann.
😎Read the description before purchasing💩
ICT Breakers (BOS/MSS) - Professional market structure and breakout detection tool.
this indicator show macd on chart.
Lightweight Risk-Reward Visualization Tool.
CandleTimer ticking remaining time.
📊 Automatically plots Fibonacci retracement and extension levels based on the most recent significant price movements.
34.45M
Traded volume
194.05K
Pips won
9
Sales
206
Free installs