"Ten Thousand Functions Bands Cloud(First Edition)" logo
Ten Thousand Functions Bands Cloud(First Edition)
"Ten Thousand Functions Bands Cloud(First Edition)" uploaded image
Since 11/09/2024
4
Sales
58
Free installs

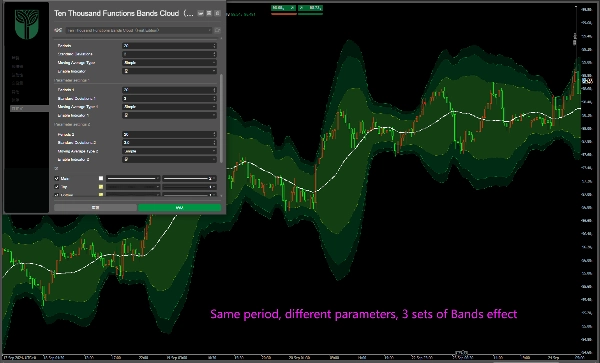
Regular 3 groups of bands:

period:20

Deviations:2.0;3.0; 3.5;

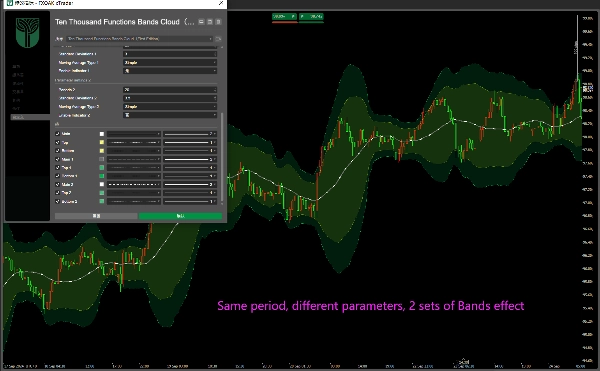
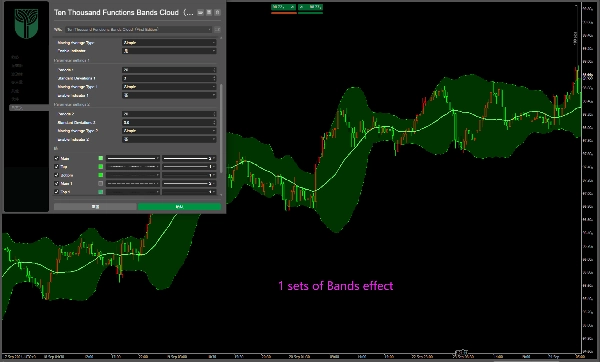
Empowered with cloud background!


You can close or open any one or two groups; And different parameters can be modified and set!


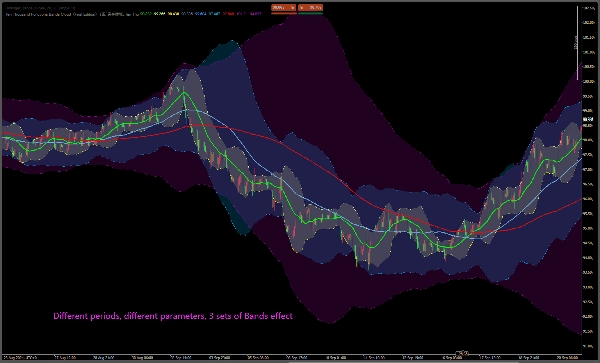
It can also be modified to other values, such as 2.0:20, 60, 144Bands;

Bands' mid track is equal to the moving average, which is the 20, 60, and 144 moving averages!


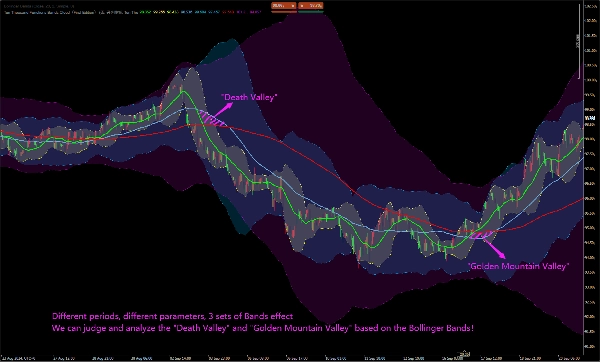
We can judge and analyze the "Death Valley" and "Golden Mountain Valley" based on the middle track of the Bollinger Bands!


常规3组Bands:

周期:20

偏差:2.0;3.0; 3.5;

支持云背景!

您可以关闭或打开任意一个或两个组;并且可以修改和设置不同的参数!

它也可以修改为其他值,如2.0:20、60、144布林带;

Bands中轨等于移动平均线,即20、60和144移动平均线!

我们可以根据布林中轨迹来判断和分析“死亡谷”和“金山谷”等......


標準3グループボリンジャーバンド(Bands):期間:20;偏差値:2.0;3.0;3.5;クラウドバックグラウンドに対応!任意の1グループまたは2グループをオン/オフ設定することが可能です。また、各パラメーターの修正と設定も行えます。他の数値に変更することも可能です。例えば2.0の偏差値で、期間20、60、144のボリンジャーバンドに設定するなど。ボリンジャーバンドの中線は移動平均線に等しく、すなわち期間20、60、144の移動平均線です。ボリンジャーバンドの中線に基づいて、「デッドバレー(死亡谷)」や「ゴールドバレー(金山谷)」などを判断・分析することができます。


Стандартные 3 группы Бандов (Полос Боллинджера): Период: 20; Отклонение: 2,0; 3,0; 3,5; Поддержка облачного фона! Вы можете отключить или включить любую одну или две группы; кроме того, вы можете изменять и настраивать различные параметры! Его также можно изменить на другие значения, например, Боллинджеры с отклонением 2,0 и периодами 20, 60, 144; Средняя линия Бандов равна скользящей средней, то есть скользящим средним с периодами 20, 60 и 144! Мы можем определять и анализировать такие явления, как «Мёртвая долина» и «Золотая долина», на основе средней линии 。


Indicator profile
0.0
Reviews: 0
Customer reviews
No reviews for this product yet. Already tried it? Be the first to tell others!
BTCUSD
RSI
EURUSD
GBPUSD
NZDUSD
Fibonacci
MACD
VWAP
Bollinger
ZigZag
ATR
Supertrend
XAUUSD
NAS100
Fair Value Gap (FVG)
USDJPY
Products available through cTrader Store, including trading bots, indicators and plugins, are provided by third-party developers and made available for informational and technical access purposes only. cTrader Store is not a broker and does not provide investment advice, personal recommendations or any guarantee of future performance.

More from this author

Three ZigZag lines
This indicator can be used to: change color, shape size, position, change font, increase or decrease, and other function
RSI T3 overbought and oversold area

You may also like

MACD Indicator with Histogram that plots Colors Based on Direction Above and Below the Zero Line.
QuickSmart One-Click Indicator — Point. Click. Smart Risk.
The Floating Risk Indicator is an essential tool for traders who prioritize risk management.
A multi-TF panel with candle timers, sessions, ticker, spread & 15+ themes. Fully customizable.
BoS ChoCH Pro,Strict Mode,False Breakout Filter,Average hit rate: 72-78%
Heatmap of intra-HTF volume (POC/VA) built from LTF tick data; paints current candle and auto-loads visible history.
KAMA Keltner – Adaptive Volatility Channel for Precision Trading
Advanced Pro Volume Profile: Double Back-to-Back, Institutional Dynamic, Fixed Range & Order Flow
Trend-coloring Donchian cloud that highlights volatility squeezes and breakouts.
TECHNICAL ANALYSIS, WITH SOUND ALERT
Allow trader to draw multi trendlines in different timeframes on one chart,Give trader an overview of the current market
Identifies high-probability breakout and retest zones using smart pivot structure and volatility filtering.
Show your Daily/Weekly Risk
Daily moving averages, simplified. Displays 3 daily moving averages on lower timeframes with selectable MA types.
Identify market structure effortlessly with swing highs, lows, CHoCH, and BOS levels for smart trading decisions! 📊🔍"
PSP is a professional-grade trading tool built to detect candle-level SMT divergence between correlated markets
Laguerre RSI is based on John EHLERS' Laguerre Filter to avoid the noise of RSI.
Tick Runs Bars extends market microstructure analysis by detecting directional persistence in trading flow.
Since 11/09/2024
4
Sales
58
Free installs