
Description
QX SmartStructure (QX SS)
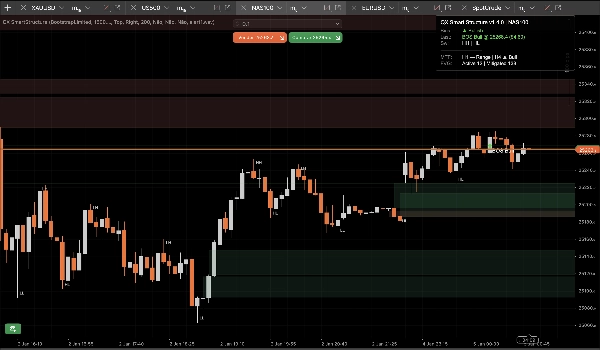
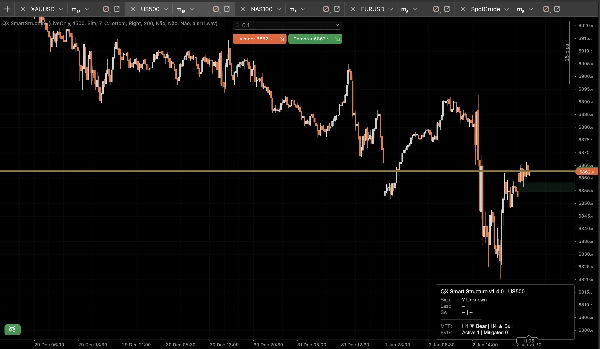
QX SmartStructure (QX SS) is a lightweight, hard-right-edge SMC overlay for cTrader. It shows current structure, BOS/CHoCH breaks, filtered + auto-managed FVG zones, and a compact H1/H4 MTF bias panel so you stop flipping timeframes.
Visualization tool only. It does not place trades.
What It Shows
1) Clean Market Structure (Hard-Right-Edge)
- Swing labels: HH / HL / LH / LL
- Key levels: last confirmed swing high and last confirmed swing low
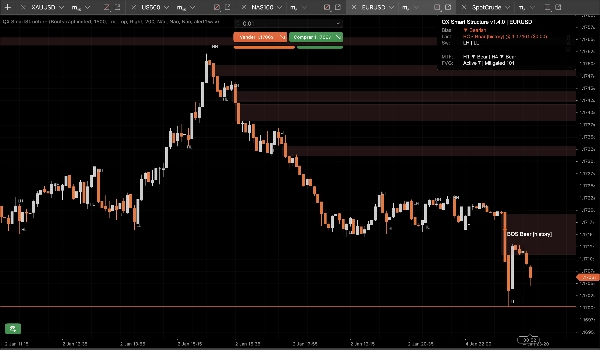
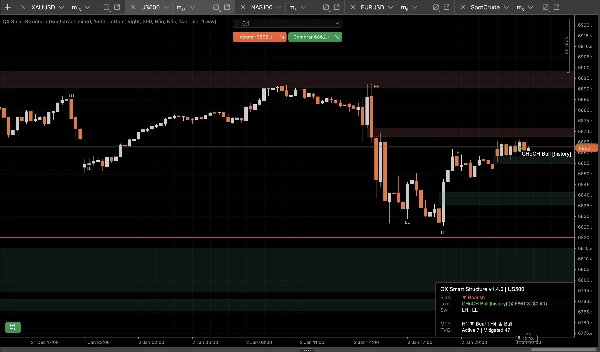
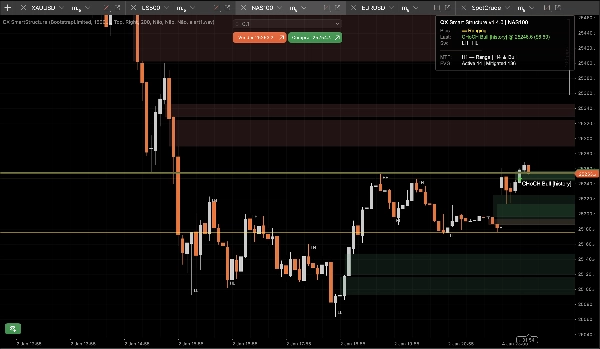
- Break events: BOS / CHoCH with strength (Strong vs Weak)
- Display modes:
- ActiveOnly (minimal)
- RecentSwings (controlled context)
2) FVG zones that stay under control
- Bullish and bearish FVG rectangles
- Min FVG Size (steps) filter removes micro-gaps automatically
- 50% mitigation rule (wick-based): a zone becomes mitigated when price reaches its half level
- Lifecycle:
- Auto-Hide Mitigated = ON for the cleanest chart
- OFF keeps mitigated zones as “ghost” context (lower opacity)
- Hard caps prevent object spam over long sessions (stored/drawn/extend-right)
3) MTF Bias Panel (H1 / H4)
A compact panel displays:
- Current timeframe bias: Bullish / Bearish / Ranging / Unknown
- Last event: BOS/CHoCH, direction, strength
- Optional snapshots: H1 bias and H4 bias
4) Optional sound alerts
Sound-only alerts for breaks, with:
- Optional alert on weak breaks
- Custom sound filename
The StepSize advantage (FX, Gold, Indices)
Most structure tools break when you switch symbols because they assume “pips” mean the same thing everywhere.
QX SS uses StepSize as a universal unit: TickSize → PipSize → Digits fallback
Convert any distance to steps
steps = price_distance ÷ TickSize
Examples (common tick sizes):
- EURUSD TickSize 0.00001: 1 pip (0.00010) = 10 steps
- XAUUSD TickSize 0.01: $0.10 = 10 steps, $1.00 = 100 steps
- Indices vary by broker:
Where to find TickSize
- In cTrader Automate: Symbol.TickSize (QX SS reads it safely)
- In the platform UI: symbol specification panel (Market Watch symbol info)
Recommended Min FVG Size (steps)
These are practical starting ranges, not universal truth. Volatility and session matter.
M15 (default workflow)
- EURUSD: 20–40 steps (≈ 2–4 pips if TickSize = 0.00001)
- XAUUSD: 30–120 steps (≈ $0.30–$1.20 if TickSize = 0.01)
- US500 / NAS100: pick a meaningful move in points, then convert:
M5 (yes, it changes)
M5 prints more micro-gaps. If you keep the same MinFVGSteps you will filter out too much.
Typical adjustment: reduce MinFVGSteps by ~30–50% versus your M15 value, then re-tune.
“Ranging” is not a bug!
Bias becomes Ranging when recent swing highs/lows do not align cleanly as HH+HL or LH+LL.
In chop, a tool that stays “Bullish” forever is lying. QX SS is conservative by design.
Presets (starting points)
Preset A: “M15 Balanced” (recommended default)
- Swing Strength (M15=7): 7
- Break Type: Close
- Confirmed Only: true
- Display Mode: RecentSwings
- Recent Swings Count: 30
- Min FVG Size (steps): EURUSD 25 | XAUUSD 60 | Indices 15 (then tune)
- Auto-Hide Mitigated: true
- Max FVG Drawn: 30
- Extend Right Bars: 50
- Show MTF H1: true
- Show MTF H4: true
Preset B: “M15 Clean Chart”
- Display Mode: ActiveOnly
- Show Swing Labels: false
- Auto-Hide Mitigated: true
- Max FVG Drawn: 15–20
- (Keep the rest from Preset A)
Preset C: “M5 Scalp Context”
- Swing Strength: 5–6
- Break Type: Either
- Confirmed Only: true (start strict)
- Show Weak Breaks: false
- Min FVG Size (steps): ~50–70% of your M15 value
- Recent Swings Count: 20–30
- Extend Right Bars: 30–50
cBot / automation integration (what QX SS exposes)
QX SmartStructure exposes 3 internal series for cBots:
- BiasSeries: 1 bullish, -1 bearish, 0 otherwise
- BreakSignalSeries: 1 bull break, -1 bear break, 0 otherwise
- BreakLevelSeries: price level on event bar, NaN otherwise (clean sentinel)
Stability and performance (v1.5.1+)
Engineered for multi-chart setups and long sessions:
- Processes only on new closed bars
- UI updates throttled by UI Throttle (ms) to keep CPU low
- Controlled object counts and pruning caps prevent chart spam
- Detects true “hard reloads” safely (timeframe/symbol/history reload) and rebuilds state without drift
New safety options (v1.5.1+)
Invalidate On Gap Jump (default ON)
If price gaps and jumps over an FVG zone without touching it (weekend/news open), the zone is marked Invalidated by Gap instead of staying active.
This prevents stale zones from remaining on chart after violent openings.
Full Series Clear On Rebuild (default OFF)
On hard rebuild, optionally clears the entire history of exposed output series for maximum backtest/export consistency.
Keep OFF for best performance on huge histories. Turn ON only for deep backtesting workflows that need full historical integrity.
Recommended defaults
- Invalidate On Gap Jump: Yes (ON)
- Full Series Clear On Rebuild: No (OFF)
Disclaimer
This tool is for visualization and decision support only. Trading is risky. Always use your own risk management.
Summary
It automatically detects and manages Fair Value Gap (FVG) zones, filtering out micro-gaps based on a configurable minimum size measured in steps, a universal unit derived from the symbol’s TickSize. The indicator applies a 50% mitigation rule to mark zones as mitigated when price reaches their midpoint, with options to auto-hide or display mitigated zones as ghosted.
QX SmartStructure includes a compact multi-timeframe (MTF) bias panel showing current timeframe bias (Bullish, Bearish, Ranging, or Unknown) and recent break events for H1 and H4 timeframes. Optional sound alerts notify users of break events, including weak breaks.
The tool supports various markets such as Forex, commodities (e.g., gold), indices, and cryptocurrencies by adapting to symbol-specific TickSize values. It exposes internal data series for integration with cBots and is optimized for performance with controlled object counts and throttled updates. The indicator does not place trades and is intended for decision support only.
Customer reviews
5 | 100 % | |
4 | 0 % | |
3 | 0 % | |
2 | 0 % | |
1 | 0 % |


!["Smart Money Concepts (SMC) [Iridio Capital]" logo](https://cdn.ctrader.com/image/webp/28b69fd1-ef54-4bed-9487-07e78e883be4_40934)


