
Description
TheVibe NASDAQ Liquidity Cycles is a professional-grade session highlighter designed specifically for the NASDAQ 100. It eliminates the need to manually track timezone differences or guess when volume will spike by putting the exact New York market hours visually right in front of you.
Because the logic is based on absolute time rather than bar counts, this indicator is completely timeframe-agnostic—working flawlessly whether you are scalping on a 1-minute chart or swing trading on a 1-hour chart.
Who is this for & How to Use It: This indicator is purpose-built for day traders and momentum traders who rely on precise timing and pure volume-driven volatility for their setups.
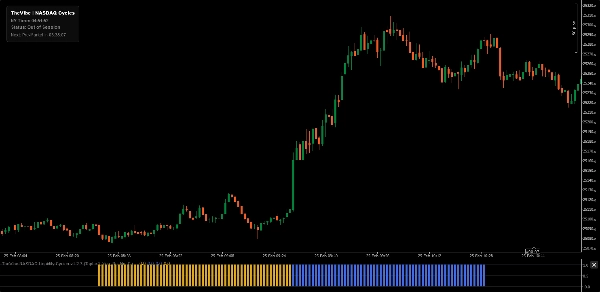
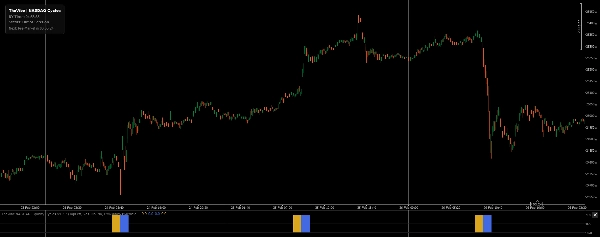
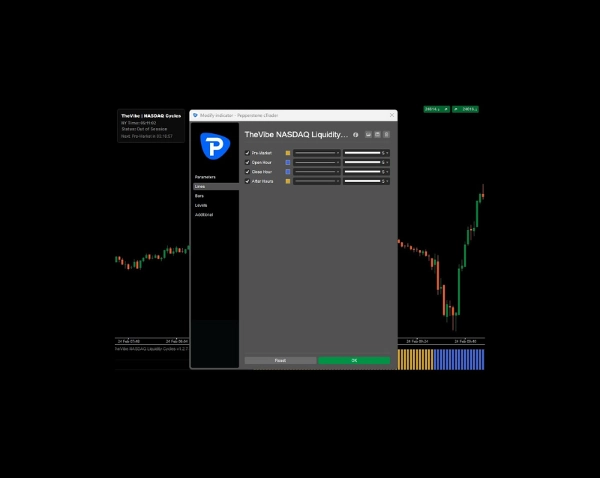
- Interpretation: The indicator plots solid, color-coded histogram blocks in the sub-window whenever a key liquidity session is active. By having this timing data visually mapped on your screen, you can effortlessly align your trading with high-probability windows and avoid choppy, low-liquidity periods without ever needing to check an external clock.
Core Liquidity Phases Tracked:
- Pre-Market (8:30 AM - 9:30 AM NY): The institutional Pre-Market hour, focusing on high-impact news and early positioning.
- Open Hour (9:30 AM - 10:30 AM NY): The opening bell volatility window, essential for initial price discovery and volume influx.
- Close Hour (3:00 PM - 4:00 PM NY): The "Power Hour" and closing cross, highlighting late-day institutional momentum and position squaring.
- After Hours (4:00 PM - 5:00 PM NY): The post-market settlement hour, capturing the final liquidity phase as standard trading concludes.
Key Features:
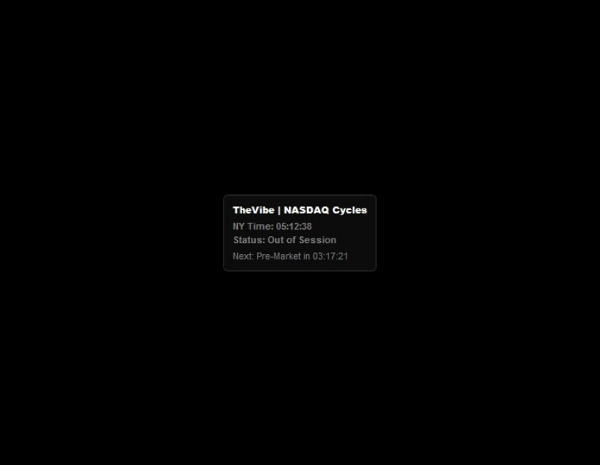
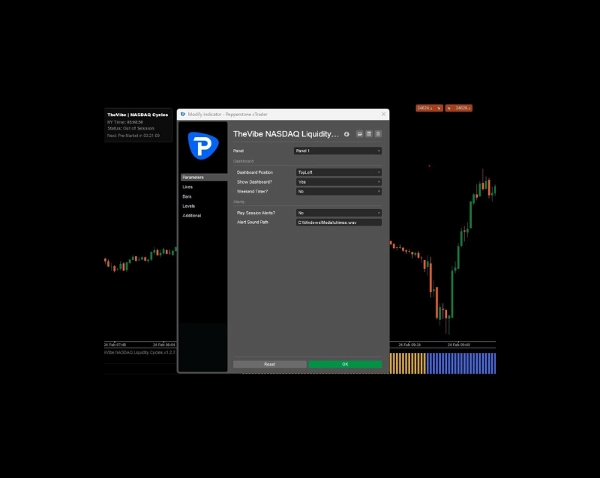
- Interactive Countdown Dashboard: A dynamic on-chart HUD that displays the exact New York time, your current active session, and a live countdown to the next liquidity window.
- Dynamic Positioning: Snap the dashboard to any of the four corners of your chart (defaults to Bottom Left) to keep your price action completely unobstructed.
- Advanced Timezone Engine: Automatically synchronizes your local or broker server time with exact New York time (handles EST/EDT automatically).
- Smart Weekend Logic: Choose to hide the countdown over the weekend or display the exact days and hours remaining until Monday's Pre-Market open.
- Audio Alerts: Optional notification chimes that trigger at the exact moment a targeted liquidity window opens or closes.
Display Recommendation: For optimal workspace management, adjust the indicator's sub-window height to a compact size. This gives you a clear, unobtrusive "rhythm bar" of the day's liquidity while preserving maximum screen real estate for your main price chart.
Note: The automated countdown timer assumes standard Monday-Friday trading hours and does not automatically account for US public holidays or early market closures.
Summary
Customer reviews
5 | 0 % | |
4 | 100 % | |
3 | 0 % | |
2 | 0 % | |
1 | 0 % |


