
Pivot Point Super Trend
Indicator
5 purchases
Version 1.0, Aug 2025
Windows, Mac
5.0
Reviews: 4
Description
Tired of lagging indicators and false signals? Discover the ultimate fusion of pivot point theory and SuperTrend momentum that gives you laser-sharp entry and exit points with professional accuracy.
🌟 WHAT MAKES THIS INDICATOR SPECIAL?
Dual-Power Technology
- Pivot Point Accuracy: Identifies key support/resistance levels using sophisticated pivot point detection
- SuperTrend Momentum: Combines ATR volatility with trend-following precision
- Smart Signal Confirmation: Eliminates false signals with built-in trend validation
Professional Features
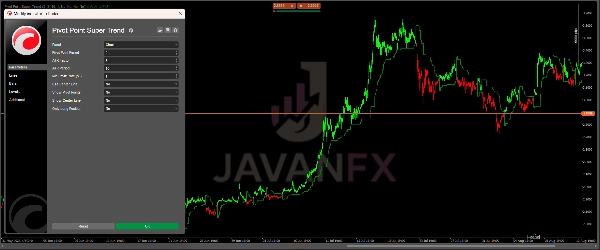
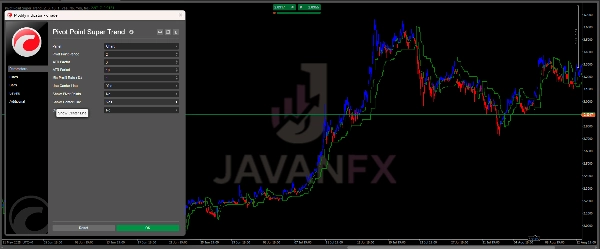
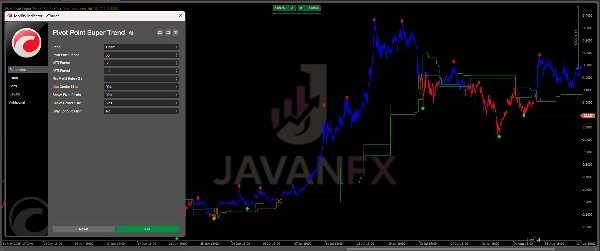
- 🎯 Visual Trend Signals: Clear color-coded lines (Green = Bullish, Red = Bearish)
- ⚡ Real-time Alerts: Instant desktop notifications for entry opportunities
- 📊 Dynamic Pivot Points: Automatically detects significant market turning points
- 🎚️ Fully Customizable: Adjust sensitivity to match any trading style or timeframe
📈 PERFECT FOR ALL MARKETS & TIMEFRAMES
Day Traders: Catch intraday trends with precision entries
Swing Traders: Ride major trends with confidence
Forex & Crypto Traders: Works exceptionally well on volatile markets
Stock & Futures Traders: Reliable across all liquid instruments
🎯 HOW TO USE (Simple & Powerful)
Basic Setup:
- Apply indicator to your chart (1min to weekly timeframes)
- Green Line: Price above = BUY signal 📈
- Red Line: Price below = SELL signal 📉
Entry Signals:
- BUY when line turns GREEN and price closes above
- SELL when line turns RED and price closes below
- Confirmation: Wait for pivot point alignment for higher accuracy
Exit Strategy:
- Stop Loss: Below/above the SuperTrend line
- Take Profit: When trend line changes color or at key pivot levels
Advanced Features:
- Center Line: Use as dynamic support/resistance for partial profit taking
- Pivot Points: Major levels act as confirmation for entries/exits
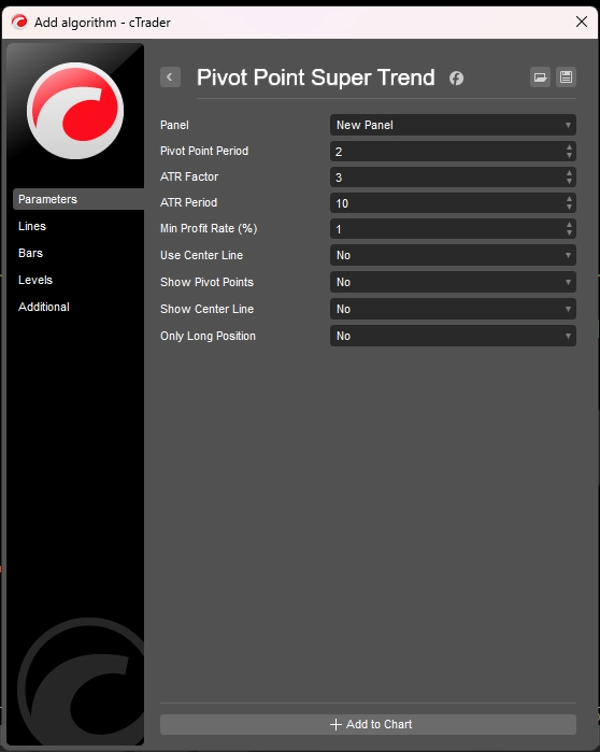
⚙️ OPTIMAL SETTINGS
Day Trading (1min - 15min):
- Pivot Period: 2-3
- ATR Factor: 2.5-3.5
- ATR Period: 10-15
Swing Trading (1H - Daily):
- Pivot Period: 3-5
- ATR Factor: 3-4
- ATR Period: 14-20
Position Trading (Weekly):
- Pivot Period: 5-7
- ATR Factor: 4-5
- ATR Period: 20-25
💡 PRO TIPS
- Combine with major support/resistance for explosive results
- Use on multiple timeframes for confluence (e.g., 1H trend + 15min entry)
- Adjust ATR Factor based on market volatility
- Backtest different settings for your specific instrument
Summary
AI summary
Pivot Point Super Trend is a technical indicator designed to provide precise entry and exit signals by combining pivot point theory with SuperTrend momentum analysis. It identifies key support and resistance levels through advanced pivot point detection and integrates Average True Range (ATR) volatility with trend-following methods to enhance signal accuracy. The indicator features smart signal confirmation to reduce false signals by validating trends before signaling trades.
Key functionalities include color-coded trend lines—green for bullish and red for bearish trends—real-time desktop alerts for trade opportunities, and dynamic pivot points that automatically detect significant market turning points. It is fully customizable, allowing traders to adjust sensitivity settings to suit various trading styles and timeframes.
This indicator supports all markets and timeframes, making it suitable for day traders, swing traders, forex, crypto, stock, and futures traders. Typical usage involves applying the indicator to charts from 1-minute to weekly intervals, interpreting green lines and price above as buy signals, and red lines with price below as sell signals, with pivot point alignment for confirmation. Exit strategies include setting stop losses relative to the SuperTrend line and taking profits at trend changes or pivot levels.
Optimal settings vary by trading style, with specific pivot periods, ATR factors, and ATR periods recommended for day trading, swing trading, and position trading. Additional features include a center line for dynamic support/resistance and partial profit-taking.
Indicator profile
Customer reviews
5.0
Reviews: 4
5 | 100 % | |
4 | 0 % | |
3 | 0 % | |
2 | 0 % | |
1 | 0 % |
Customer reviews
October 10, 2025
Solid fusion ⚡ Pivot + SuperTrend = clean reversals & trend rides. Marks key zones with precision — great edge for intraday and swing trades!
September 4, 2025
the review gets easier when fewer random clicks reach the trade log, and 30 AI calls is a fair first sample.
September 4, 2025
The first test should keep DD under 3 percent, and the idea does not go straight to execution.
August 26, 2025
Not perfect, but the workflow felt cleaner. It works better with a written plan.
Discussion
FAQ
Products available through cTrader Store, including trading bots, indicators and plugins, are provided by third-party developers and made available for informational and technical access purposes only. cTrader Store is not a broker and does not provide investment advice, personal recommendations or any guarantee of future performance.


Price
Since 14/07/2025
60
Sales