
Zero Lag LSMA
Indicator
6 purchases
Version 1.0, Aug 2025
Windows, Mac
4.6
Reviews: 3
Description
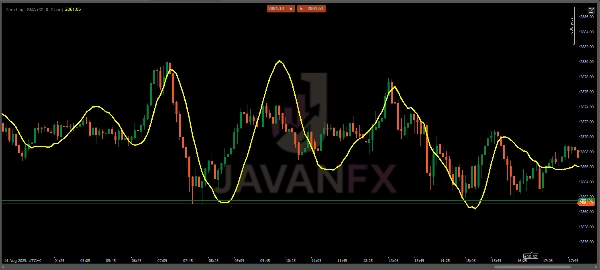
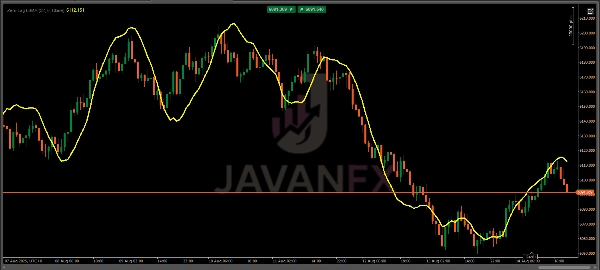
The Zero Lag LSMA (Least Squares Moving Average) is a cutting-edge technical indicator designed for traders seeking enhanced responsiveness and precision in trend analysis. Unlike traditional moving averages that lag behind price action, It minimizes lag by applying a double linear regression process, making it ideal for identifying trend direction and potential reversals in real-time. This indicator is perfect for forex, stocks, commodities, and other markets.
Key Features
- Zero-Lag Performance: Reduces the delay inherent in traditional moving averages, providing faster signals for trend changes.
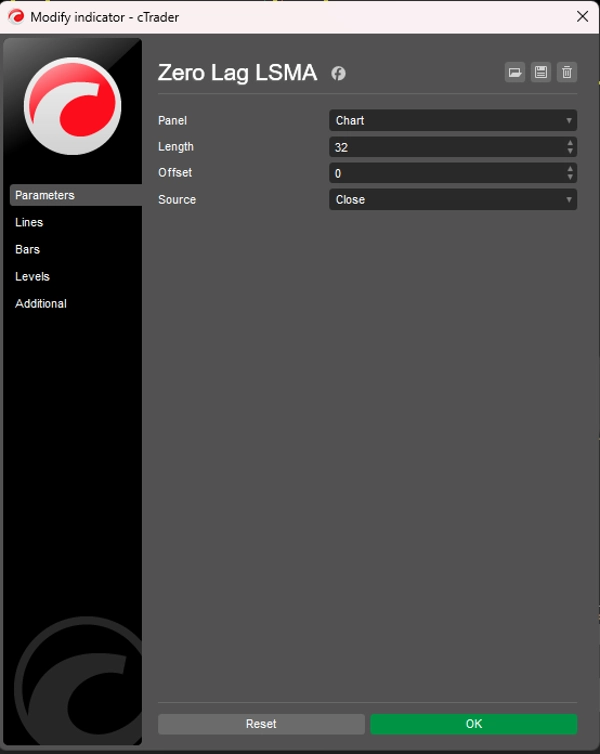
- Customizable Parameters: Adjust the length, offset, and price source (Open, High, Low, Close) to suit your trading strategy.
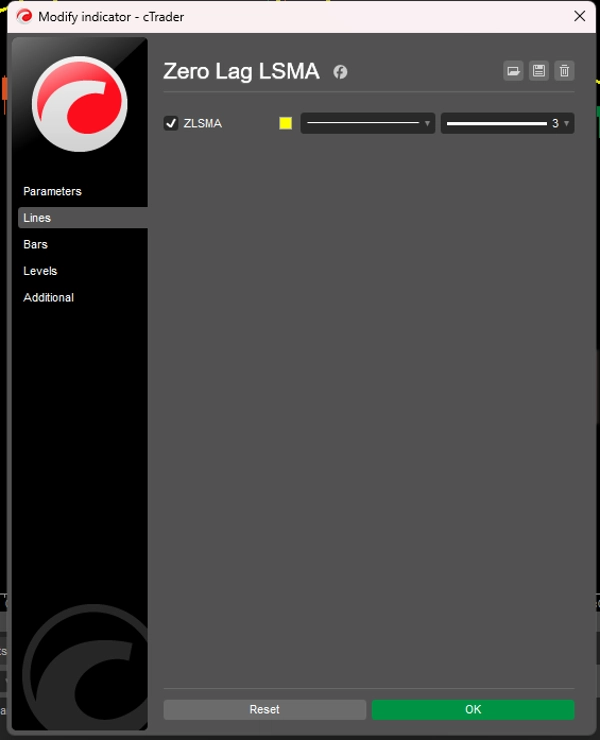
- Visually Intuitive: Displays as a smooth, yellow line overlaid on the price chart for easy interpretation.
- Versatile Application: Suitable for scalping, day trading, swing trading, and long-term strategies across various timeframes.
How to Use
- Trend Identification:
- When the ZLSMA line slopes upward, it indicates a bullish trend.
- A downward slope suggests a bearish trend.
- Flat or choppy movement may indicate consolidation or lack of trend.
- Entry/Exit Signals:
- Buy Signal: Enter a long position when the price crosses above the ZLSMA line, especially after a confirmed uptrend.
- Sell Signal: Enter a short position when the price crosses below the ZLSMA line during a downtrend.
- Exit Signal: Consider exiting when the price crosses back through the ZLSMA or when the line flattens, indicating a potential trend reversal.
- Confirmation:
- Combine ZLSMA with other indicators (e.g., RSI, MACD) or support/resistance levels to confirm signals and avoid false breakouts.
- Use on higher timeframes (H1, H4, D1) for stronger trend signals or lower timeframes (M5, M15) for scalping.
Trading Strategies
- Trend Following: Use ZLSMA to ride strong trends by entering on pullbacks to the ZLSMA line in the direction of the trend.
- Reversal Trading: Look for price divergence from the ZLSMA line combined with candlestick patterns (e.g., pin bars, engulfing candles) for reversal setups.
- Breakout Trading: Monitor price breakouts above/below the ZLSMA during high volatility periods for potential entry points.
Tips for Optimal Use
- Adjust Length for Market Conditions: Use a shorter length (e.g., 10-20) for faster markets or scalping, and a longer length (e.g., 50-100) for smoother trends in higher timeframes.
- Test on Demo Account: Before using in live trading, backtest the ZLSMA on a demo account to understand its behavior in your preferred markets.
- Avoid Overtrading in Choppy Markets: ZLSMA performs best in trending markets; use additional filters (e.g., ADX) to avoid whipsaws in sideways markets.
Summary
AI summary
The Zero Lag LSMA (Least Squares Moving Average) is a technical indicator designed to enhance trend analysis by minimizing the lag typical of traditional moving averages. It uses a double linear regression process to provide faster and more responsive signals, making it suitable for real-time identification of trend direction and potential reversals. The indicator is applicable across various markets including forex, stocks, and commodities.
Key features include customizable parameters such as length, offset, and price source (Open, High, Low, Close), allowing adaptation to different trading strategies. It displays as a smooth yellow line overlaid on the price chart for clear visual interpretation. The indicator supports multiple trading styles and timeframes, from scalping to long-term strategies.
Traders use the Zero Lag LSMA to identify trends by observing the slope of the line: upward for bullish trends, downward for bearish, and flat for consolidation. Entry and exit signals are generated when price crosses the LSMA line, with additional confirmation recommended through other indicators or support/resistance levels. The indicator supports trend following, reversal, and breakout trading strategies, with adjustable settings to optimize performance under varying market conditions.
Indicator profile
Customer reviews
4.6
Reviews: 3
5 | 67 % | |
4 | 33 % | |
3 | 0 % | |
2 | 0 % | |
1 | 0 % |
Customer reviews
October 10, 2025
Zero lag, full clarity ⚡ LSMA tracks price action like a scalpel — sharp, fast, and smooth. Great trend filter for any timeframe!
August 27, 2025
The only reason it stays interesting is the setup needs less second guessing. A normal demo run is enough to see the weak spots.
August 16, 2025
Not bad if the rules are already clear. Spread and slippage need a line in the notes.
Discussion
FAQ
Products available through cTrader Store, including trading bots, indicators and plugins, are provided by third-party developers and made available for informational and technical access purposes only. cTrader Store is not a broker and does not provide investment advice, personal recommendations or any guarantee of future performance.


!["[Hamster-Coder] Pivot Points MTF" logo](https://cdn.ctrader.com/image/webp/4c143e5a-309c-40e3-a578-f04d1e133ffa_31159)


Price
Since 14/07/2025
60
Sales