
Description
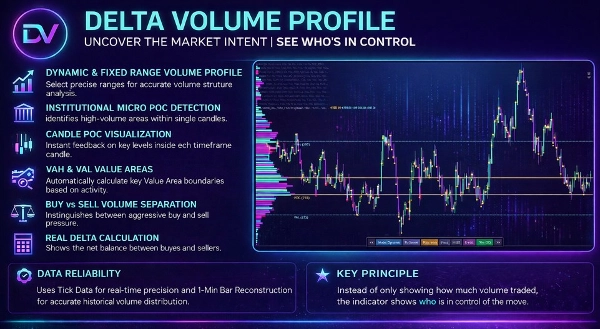
Advanced Pro Volume Profile: Institutional Fixed Range & Order Flow
Upgrade your market analysis with the Advanced Pro Volume Profile, a highly optimized, institutional-grade indicator designed for traders. Built for day traders, scalpers, and swing traders who rely on Auction Market Theory, this tool brings precision to Volume Distribution, Value Areas, and Order Flow dynamics.
Unlike standard retail volume profiles that constantly recalculate, shift, or break when you zoom in and out, this indicator introduces a True Anchor Mode (Fixed Range) with memory retention, making it the ultimate tool for live trading and rigorous historical back.
🔥 Core Features & Trading Edge
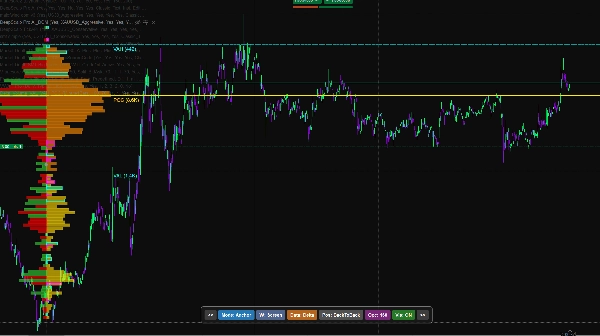
1. True Anchor Mode (Perfect for back)
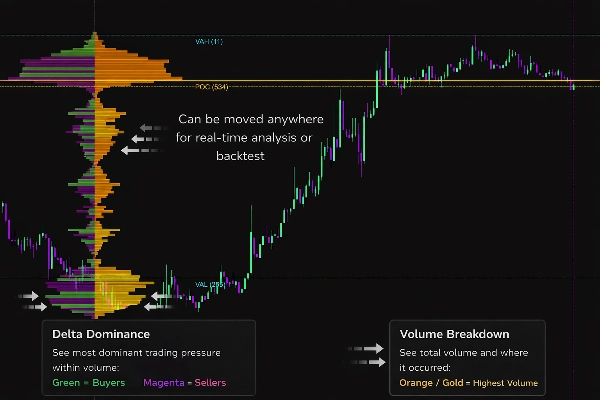
Stop wrestling with shifting profiles! With our Anchor Mode, you can drop two interactive vertical lines anywhere on your chart to analyze a specific swing, session, or consolidation zone.
- Zero Distortion: Zoom in, zoom out, or scroll—the profile remains mathematically locked to your chosen anchor points.
- Historical back: Scroll back months or years in time, anchor the profile to a past market event, and analyze the exact volume distribution and Point of Control (POC) as it happened. The anchors remember their exact positions, allowing you to study past setups flawlessly without the grid resetting.
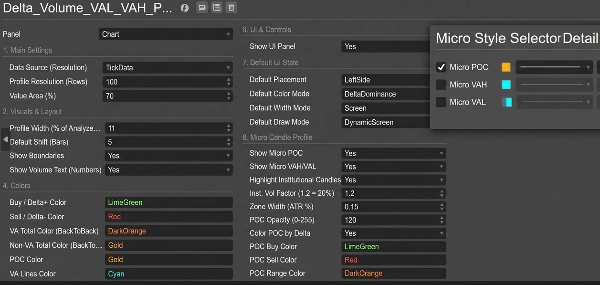
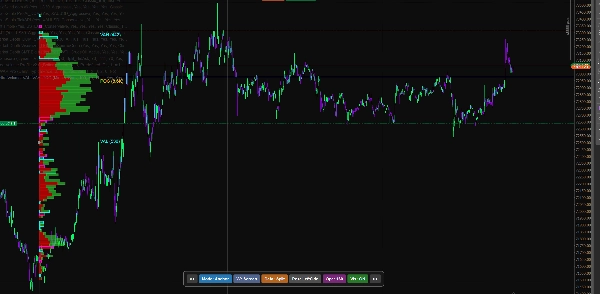
2. Interactive On-Chart UI Panel
No need to constantly open the indicator settings. A sleek, non-intrusive UI panel at the bottom of your chart allows you to:
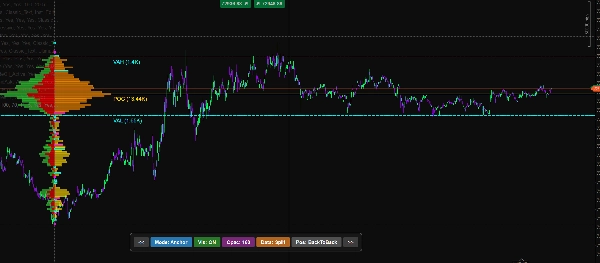
- Toggle between Screen Mode (Dynamic) and Anchor Mode (Fixed Range) with one click.
- Shift the profile's position (Left, Right, Back-to-Back).
- Adjust the Visual Width and Opacity on the fly.
- Switch between Buy/Sell Split and Delta Dominance volume coloring.
3. Deep Order Flow Insights
Read the micro-structure of the market like a professional:
- Delta Dominance & Splitting: Visualize aggressive market buying vs. market selling inside every price node.
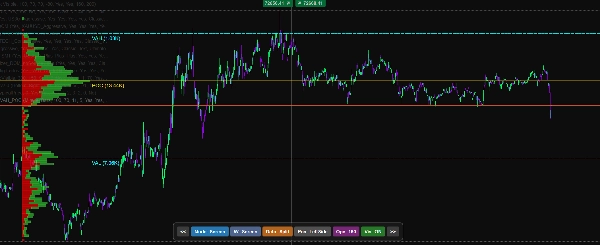
- Volume Imbalances: Automatically detect and highlight massive buy/sell imbalances (customizable ratio, e.g., 300% dominance) to spot institutional absorption or aggressive breakouts.
- HVN & LVN Detection: Clearly identifies High Volume Nodes (magnets for price) and Low Volume Nodes (liquidity voids where price moves rapidly).
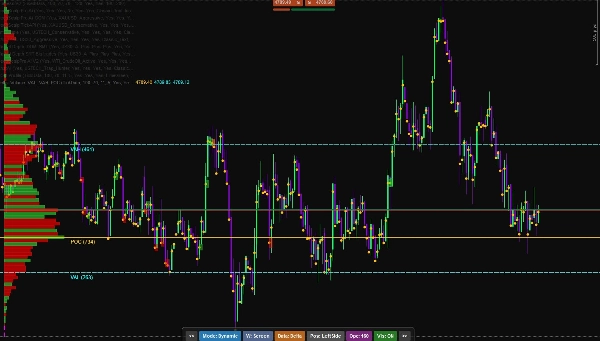
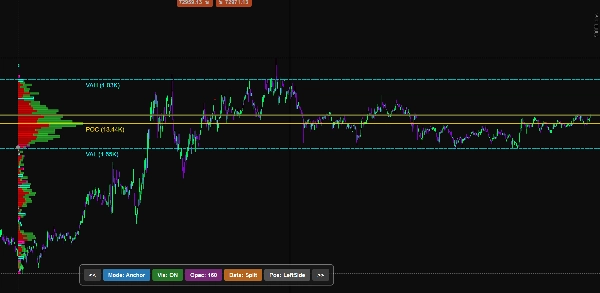
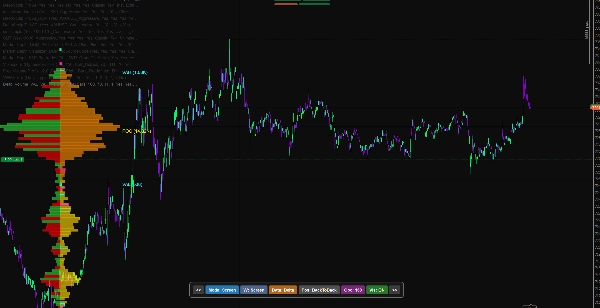
4. Dynamic Value Area & Naked POC
- Displays precise Value Area High (VAH) and Value Area Low (VAL) lines based on standard deviations (default 70%).
- Highlights the Point of Control (POC).
- Extend Naked POC: Automatically extends unchecked POC lines into the future, providing you with highly reactive support and resistance targets.
5. Highly Optimized
- Data Sources: Choose between hyper-accurate Tick Data or lightweight 1-Minute Bar data for long-term historical analysis.
- Smart Rendering: Engineered to handle massive amounts of data without freezing your platform.
🛠️ How to Use It for learning when not trading:
- Scroll back to your desired date on the chart.
- Click "Mode: Anchor" on the UI panel.
- Drag the two vertical dotted lines to encapsulate the exact price swing or trading session you want to analyze.
- The Volume Profile instantly generates. You can zoom in to the 1-minute chart to inspect the exact entry points, imbalances, and Value Area retests without the profile losing its place!
Take control of your charts. Stop trading retail patterns and start trading institutional volume.
Summary
An interactive on-chart UI panel enables quick toggling between dynamic Screen Mode and fixed Anchor Mode, profile position adjustments, visual customization, and switching between Buy/Sell Split and Delta Dominance volume coloring. The tool offers deep order flow insights, including visualization of aggressive buying versus selling, automatic detection of volume imbalances, and identification of High Volume Nodes (HVN) and Low Volume Nodes (LVN).
It displays dynamic Value Area High (VAH), Value Area Low (VAL), and Point of Control (POC) lines, with an option to extend naked POC lines as future support/resistance targets. Users can select data sources between tick data and 1-minute bars for optimized performance and historical analysis. The indicator is engineered for efficient rendering to handle large datasets without platform lag.
Customer reviews
5 | 50 % | |
4 | 50 % | |
3 | 0 % | |
2 | 0 % | |
1 | 0 % |


