Description
VOLUME PROFILE FIXED RANGE — PRO
Most indicators tell you where price went. Volume Profile tells you where the market actually traded — the levels where buyers and sellers committed real volume. Those are the levels that keep acting as support, resistance and price magnets long after the move is over.
This indicator brings a complete, professional Volume Profile to cTrader: select any range on your chart, or let it build one profile per trading day automatically, and instantly see the volume structure, Point of Control and Value Area.
🆕 NEW IN VERSION 3
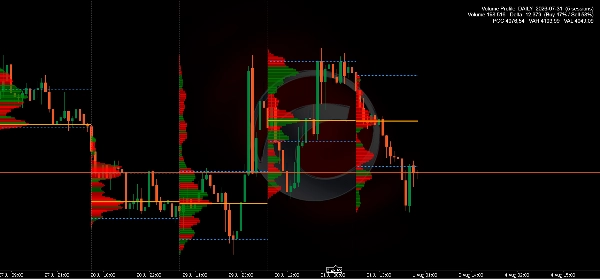
• Daily profiles — every trading day gets its own profile, POC and Value Area, drawn inside that day and built automatically as you scroll.
• Short sessions merged — the thin Sunday open and holiday half days roll into the next trading day instead of leaving stunted little profiles behind.
• Histogram inside the range — a third position that anchors the profile to its own range instead of the chart edge, so it stays where it belongs while you scroll.
• Levels that stay in their range — POC, VAH and VAL can span only their own session rather than the whole chart, which keeps multiple profiles readable.
• Level alerts — optional notification when price touches POC, VAH or VAL, with a cooldown so a level being tested doesn't spam you.
• Live profile — the current candle's volume is included as it trades, not only after the bar closes.
📊 WHAT IT SHOWS
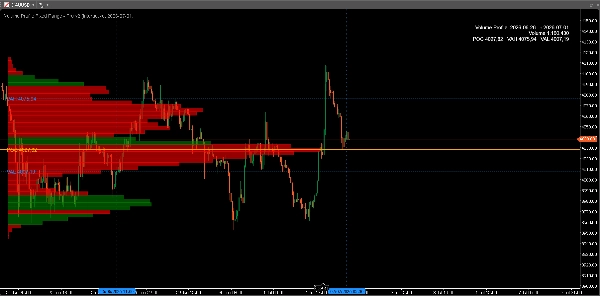
• POC (Point of Control) — the price level with the highest traded volume in the range.
• Value Area (VAH / VAL) — the zone containing 70% of all volume (adjustable from 50% to 95%), calculated with the standard Market Profile expansion method so your levels match what professionals see on other platforms.
• Volume histogram — 10 to 400 price rows, each row split into buying and selling volume so absorption and imbalance are visible at a glance.
• Developing POC — how the fairest price evolved across the range (optional).
• Minute-level precision — the profile is built from M1 data even on H1 or Daily charts, far more accurate than bar-based approximation.
🎯 HOW TRADERS USE IT
• Trade reactions at POC — it often behaves as strong support/resistance and a mean-reversion magnet.
• Use Value Area edges to define range boundaries and spot genuine breakouts.
• Compare today's developing profile against yesterday's to see whether value is moving up, down or holding.
• Identify low-volume zones where price tends to move fast — natural targets and stop areas.
• Confirm your key levels with actual market participation instead of price action alone.
⚙️ FULLY ADJUSTABLE
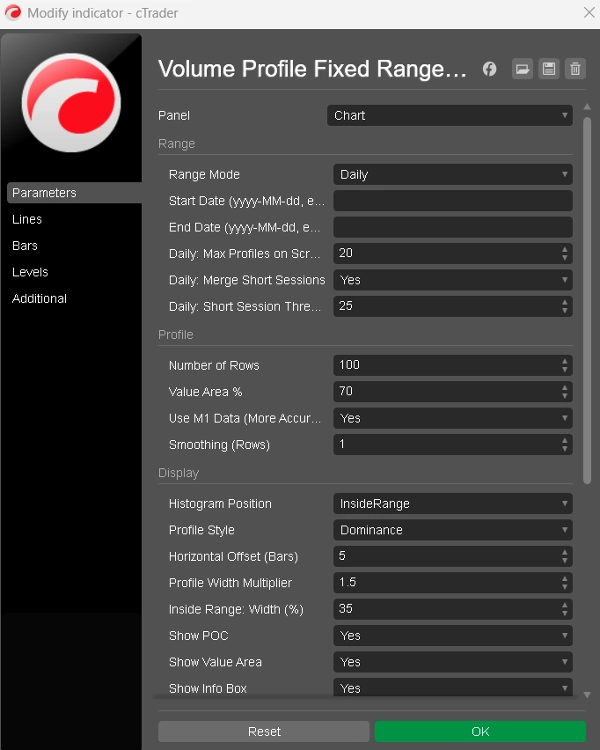
• Three range modes: drag two lines on the chart, type fixed dates, or Daily.
• Three histogram positions: right edge, left edge, or inside the range.
• Rows, Value Area percentage, smoothing, width, offset and row borders.
• Two histogram styles: buy/sell split or single dominance color.
• Every color customizable; POC, Value Area, day separators, info panel and Developing POC can each be toggled, and the info panel can sit in any corner.
🔧 BUILT FOR DAILY USE
• Works on any symbol and any timeframe.
• Sensible defaults — a usable profile appears seconds after you attach it, no setup required.
• Your selected range survives timeframe switches and restarts.
• Older history is loaded automatically when your range needs it, and the chart tells you when the available data doesn't cover the request.
• Smooth and efficient: the profile follows scrolling and zooming without flicker, and recalculates only when it has to.
• One-time purchase. No subscription. Free updates.
If volume analysis is part of your process — or you want it to be — this gives you the complete Volume Profile toolset, built natively for cTrader.
Summary
Users can interactively select the range by dragging lines on the chart or specify fixed start and end dates. The volume histogram displays buy and sell volume splits per price level, enabling identification of buying/selling pressure and volume imbalances. Additional features include a developing POC line showing how the fair price evolved within the range, adjustable smoothing for profile shape refinement, and a theme-aware design for readability on different chart backgrounds.
The indicator supports full customization of rows, histogram style, colors, and display elements. It automatically loads historical data as needed and recalculates only when the selected range changes, optimizing performance. It is suitable for any symbol and timeframe, providing traders with volume-based support and resistance levels, breakout zones, and areas of low volume that may indicate rapid price movement.
Customer reviews
5 | 67 % | |
4 | 0 % | |
3 | 33 % | |
2 | 0 % | |
1 | 0 % |


!["[Stellar Strategies] Inside Bar with Signals" logo](https://cdn.ctrader.com/image/webp/1d9e8bfa-3b2c-4440-bb37-5856902008a7_30683)