
HTFBB
Indikator
1 käufe
Version 1.0, Jul 2025
Windows, Mac
5.0
Bewertungen: 1
Beschreibung
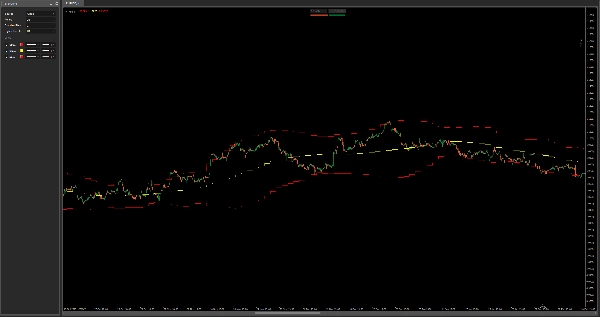
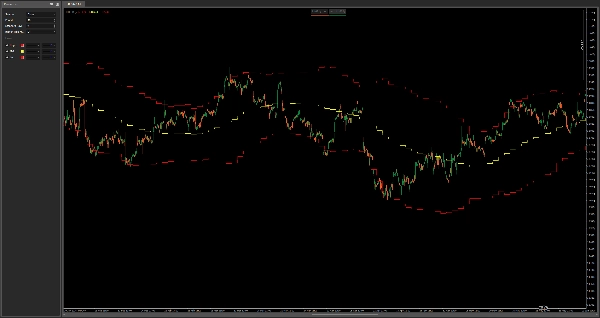
HTF Bollinger-Bänder – Multi-Timeframe-Volatilitätskarte
Dieser Indikator zeichnet Bollinger-Bänder aus einem höheren Zeitrahmen in Ihr aktuelles Chart und bietet Ihnen so einen starken Kontext für Volatilität, Mittelwertumkehr und dynamische Unterstützung/Widerstand – alles ohne Zeitrahmenwechsel.
Funktionen:
- Zeigt obere, mittlere und untere Bollinger-Bänder aus jedem wählbaren höheren Zeitrahmen an
- Ideal zum Erkennen von HTF-Konsolidierungszonen, Ausbruchsdruck und Trend-Rücksetzern
- Ideal für Scalping und Intraday-Einstiege mit Bewusstsein für höhere Zeitrahmen
- Funktioniert bei allen Assets und Zeitrahmen
Kombinieren Sie es mit Ihrer aktuellen Strategie, um Volatilitätsfallen zu vermeiden und im Einklang mit der makroökonomischen Preisstruktur zu bleiben.
Zusammenfassung
Indikatorprofil
Kundenbewertungen
5.0
Bewertungen: 1
5 | 100 % | |
4 | 0 % | |
3 | 0 % | |
2 | 0 % | |
1 | 0 % |
Kundenbewertungen
July 29, 2025
confusing signals get easier to ignore, but a clean signal can still fail.
Diskussion
Häufig gestellte Fragen (FAQ)
Über den cTrader Store verfügbare Produkte, einschließlich Handelsbots, Indikatoren und Plugins, werden von externen Entwicklern bereitgestellt und nur zu Informations- und technischen Zugriffszwecken verfügbar gemacht. cTrader Store ist kein Broker und erbringt keine Anlageberatung, persönlichen Empfehlungen oder eine Garantie für zukünftige Performance.


Preis
Seit 03/01/2025
638.03K
Gehandeltes Volumen
21.34K
Pip-Gewinn
15
Verkäufe