


คำอธิบาย
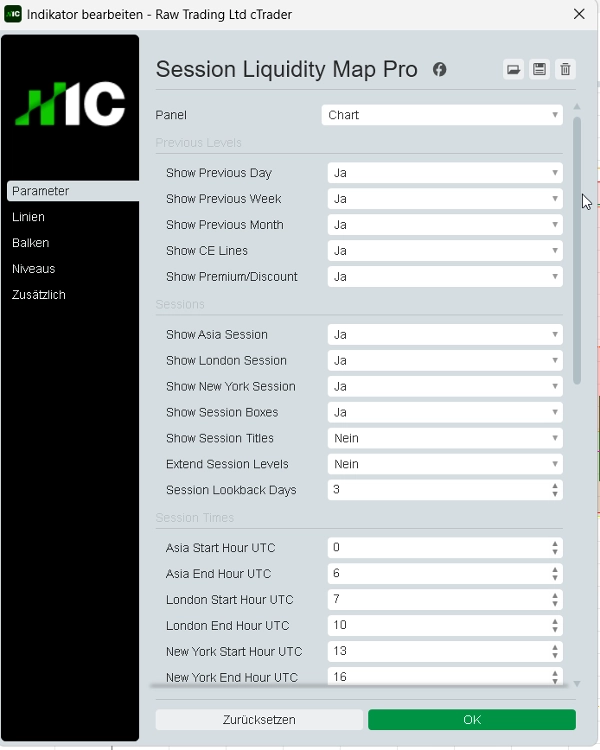
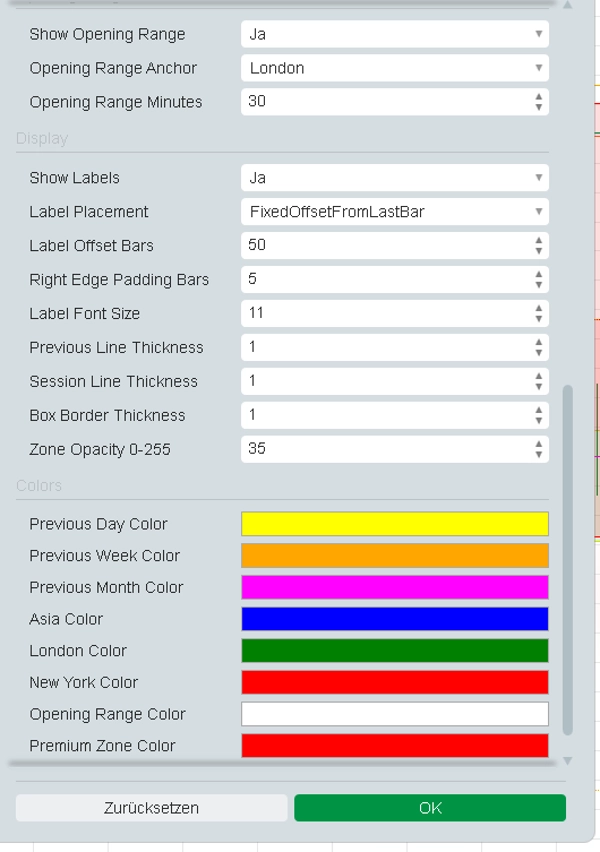
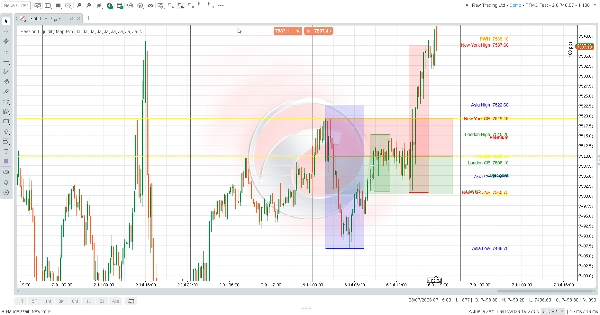
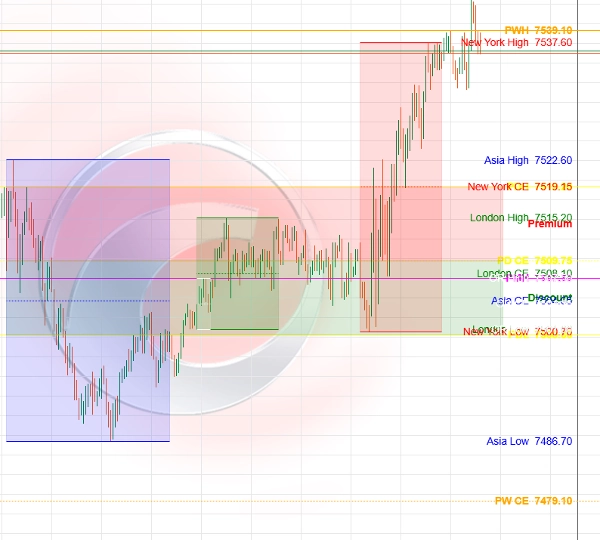
Session Liquidity Map Pro เป็นตัวบ่งชี้ cTrader แบบภาพสำหรับการวิเคราะห์การเคลื่อนไหวของราคาอย่างมีโครงสร้าง โดยจะแสดงระดับสูง/ต่ำของวัน สัปดาห์ และเดือนก่อนหน้าพร้อมระดับสมดุล ช่วงเวลาการซื้อขายของเอเชีย/ลอนดอน/นิวยอร์ก ระดับช่วงเปิดตลาด และโซนพรีเมียม/ส่วนลดโดยอัตโนมัติ
ตัวบ่งชี้นี้ถูกออกแบบมาเพื่อการเตรียมแผนภูมิ การวิเคราะห์ตามสภาพคล่อง การทบทวนโครงสร้างตลาด และการวิจัยการทดสอบย้อนหลัง ไม่ทำการซื้อขายจริง ไม่ให้สัญญาณซื้อ/ขาย และไม่ต้องการการเข้าถึงแบบเต็ม
การซื้อขายมีความเสี่ยง ผลการดำเนินงานในอดีตไม่ได้รับประกันผลลัพธ์ในอนาคต
สรุป
AI summary
Session Liquidity Map Pro is a visual indicator for the cTrader platform designed to enhance structured price action analysis. It automatically maps key market data on your chart, including previous day, week, and month highs and lows, equilibrium levels, and session ranges for Asia, London, and New York. The indicator also highlights opening range levels and premium/discount zones, aiding in liquidity-based analysis and market structure review.
This tool supports chart preparation and backtesting research by visually presenting critical price levels and zones relevant to market participants. It does not execute trades or provide buy/sell signals and operates without requiring full access permissions. The indicator is categorized under market structure and provides visual outputs to assist traders in identifying liquidity sweeps, market structure shifts, key levels, and premium/discount areas.
Session Liquidity Map Pro is suitable for traders focusing on market structure concepts and price action analysis, offering a comprehensive overview of session dynamics and historical price points to inform trading decisions.
This tool supports chart preparation and backtesting research by visually presenting critical price levels and zones relevant to market participants. It does not execute trades or provide buy/sell signals and operates without requiring full access permissions. The indicator is categorized under market structure and provides visual outputs to assist traders in identifying liquidity sweeps, market structure shifts, key levels, and premium/discount areas.
Session Liquidity Map Pro is suitable for traders focusing on market structure concepts and price action analysis, offering a comprehensive overview of session dynamics and historical price points to inform trading decisions.
โปรไฟล์อินดิเคเตอร์
หมวดหมู่อินดิเคเตอร์
โครงสร้างตลาด (SMC)
ประเภทเอาต์พุต
การแสดงเป็นภาพ
ข้อกำหนดด้านข้อมูล
แท่งเท่านั้น
สัญญาณที่รองรับ
Reversal
Breakout
ความแข็งแกร่งของแนวโน้ม
แตะ Level ที่ระบุ
เบรก Level ที่ระบุ
Range ณ เวลาที่เปิดเซสชัน
รีวิวจากลูกค้า
0.0
รีวิว: 0
รีวิวจากลูกค้า
ยังไม่มีรีวิวสำหรับผลิตภัณฑ์นี้ หากเคยลองแล้ว ขอเชิญมาเป็นคนแรกที่บอกคนอื่น!
การสนทนา
คำถามที่พบบ่อย
Premium/Discount
Supertrend
Key Levels
MSS
Liquidity Sweep
Market Structure
ผลิตภัณฑ์ที่มีให้บริการผ่าน cTrader Store รวมถึงบอทการเทรด อินดิเคเตอร์ และปลั๊กอิน มีให้บริการโดยนักพัฒนาบุคคลที่สามและมีไว้เพื่อวัตถุประสงค์ในการเข้าถึงข้อมูลและทางเทคนิคเท่านั้น cTrader Store ไม่ใช่โบรกเกอร์และไม่ได้ให้คำแนะนำการลงทุน คำแนะนำส่วนบุคคล หรือการรับประกันผลการดำเนินงานในอนาคต
เพิ่มเติมจากผู้เขียนคนนี้

























!["[Stellar Strategies] Market Session Ultimate" โลโก้](https://cdn.ctrader.com/image/webp/61ffd537-0125-4246-9e72-42eca1791d64_28232)
ราคา
4
การขาย