
VegaXLR - Candlestick Patterns Pro
Indikator
6 käufe
Version 1.0, Mar 2025
Windows, Mac
5.0
Bewertungen: 3
Beschreibung
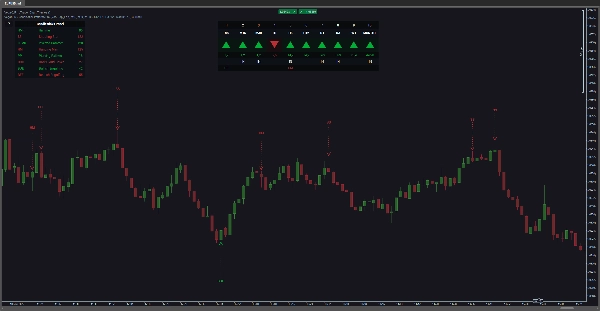
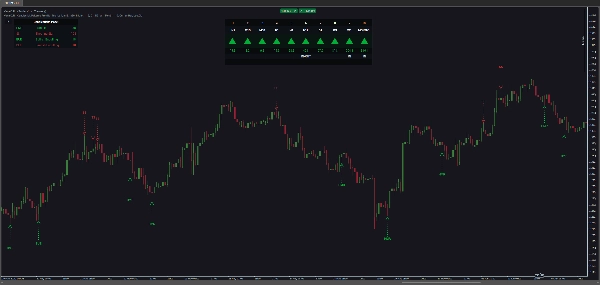
Der cTrader Candlestick Patterns Pro ist ein fortschrittlicher Handelsindikator, der entwickelt wurde, um 34 Candlestick-Muster über mehrere Zeitrahmen hinweg zu identifizieren. Er bietet Händlern eine klare und organisierte Anzeige, die ihnen hilft, schnell und effizient fundierte Entscheidungen zu treffen.
Lösen Sie Handelsherausforderungen mühelos
Dieses Tool ist perfekt für Händler, die:
- bullische und bärische Candlestick-Muster mühelos erkennen möchten.
- Markttrends über mehrere Zeitrahmen in Echtzeit überwachen wollen.
- sofortige Benachrichtigungen für umsetzbare Handelsmöglichkeiten erhalten möchten.
- Positionsmanagement und cBot-Operationen basierend auf bestimmten Mustern oder Ereignissen automatisieren möchten.
Hauptmerkmale
- Umfassende Musterekennung: Erkennt 34 Candlestick-Muster, einschließlich Doji, Engulfing, Morning/Evening Stars und mehr.
- Multi-Timeframe-Analyse: Verfolgt bis zu 10 Zeitrahmen gleichzeitig für eine breitere Marktübersicht.
- Fortschrittliches Alarmsystem: Erhalten Sie Benachrichtigungen per Ton, Pop-up, Telegram oder E-Mail für wichtige Muster und Marktereignisse.
- Automatisierung des Positionsmanagements: Schließen Sie Positionen automatisch oder steuern Sie cBots basierend auf bestimmten Alarmen.
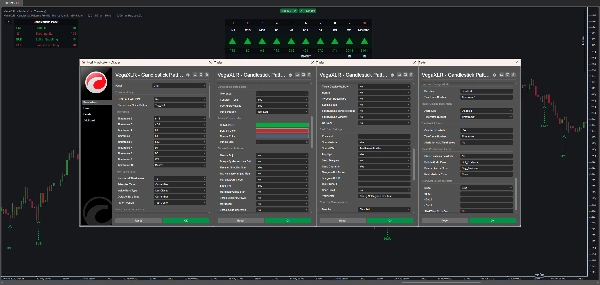
- Anpassbare Benutzeroberfläche: Passen Sie Farben, Größen und Positionen des Panels an Ihre Vorlieben an.
- Benutzerfreundliche Einstellungen: Konfigurieren Sie Trendüberlegungen, Toleranzstufen und Musterabkürzungen für maßgeschneiderte Einblicke.
Neueste Updates
- Version 1.1: Hinzugefügte Warnungen bei Richtungsänderungen in beide Richtungen und Behebung kleinerer Pop-up-Probleme in cTrader.
- Version 1.2: Verbesserte Telegram-Warnungen, Integration von Imgur für Chartshot-Warnungen und Hinzufügung eines Benutzerhandbuch-Buttons im Chart.
Unterstützte Alarmtypen
- Warnungen für Candlestick-Muster über mehrere Zeitrahmen hinweg.
- Benachrichtigungen bei Richtungsänderungen des Marktes.
- Warnungen für Inside- und Outside-Bar-Formationen.
Erkennbare Muster
Einige der 34 Muster umfassen:
- Doji-Variationen (Vier-Preis, Standard, Langbeinig, Libelle, Grabstein)
- Hammer, Shooting Star, Inverted Hammer, Hanging Man
- Engulfing-Muster (bullisch und bärisch)
- Morning/Evening Stars, Three White Soldiers, Three Black Crows
- Harami (bullisch und bärisch), Tweezer Top/Bottom
- Spinning Top, Rising/Falling Three Methods und mehr.
Vereinfachen Sie Ihren Handelsprozess, bleiben Sie den Marktbewegungen voraus und treffen Sie intelligentere Entscheidungen mit dem cTrader Candlestick Patterns Pro Indikator.
Zusammenfassung
KI-Zusammenfassung
VegaXLR - Candlestick Patterns Pro is an advanced trading indicator for the cTrader platform that identifies 34 distinct candlestick patterns across multiple timeframes. It supports real-time monitoring of up to 10 timeframes simultaneously, providing a comprehensive market perspective. The indicator features an organized display to help traders quickly recognize bullish and bearish patterns such as Doji variations, Engulfing, Morning/Evening Stars, Hammer, Shooting Star, Harami, and more.
Key functionalities include an advanced alert system that notifies users via sound, pop-up, Telegram, or email about important patterns and market events. It also enables automation of position management and cBot operations based on specific alerts. The interface is customizable, allowing adjustment of panel colors, sizes, and positions, while user-friendly settings let traders configure trend considerations, tolerance levels, and pattern abbreviations for tailored insights.
Supported alert types cover candlestick patterns, market direction changes, and inside/outside bar formations. Recent updates have enhanced alert capabilities and integrated chartshot alerts via Imgur, along with a user guide accessible directly on the chart. This tool is designed to assist traders in simplifying their analysis, staying ahead of market movements, and making informed trading decisions efficiently.
Indikatorprofil
Kundenbewertungen
5.0
Bewertungen: 3
5 | 100 % | |
4 | 0 % | |
3 | 0 % | |
2 | 0 % | |
1 | 0 % |
Kundenbewertungen
March 14, 2025
Clean trade assistant if the trader wants it makes common setups easier to notice. It works best as support, not a final decision maker. I would only count patterns with 2 confirmations, a 1R stop plan and at least 20 candles of context. patterns still need trend and context.
March 13, 2025
March 13, 2025
Practical demo helper for traders who use visual price action. It gives value around pattern detection, but patterns still need trend and context. A fair sample is 30 pattern signals filtered by trend, not every candle that looks clean. The pattern is helpful when it supports the plan, not when it becomes the plan.
Diskussion
Häufig gestellte Fragen (FAQ)
Forex
Über den cTrader Store verfügbare Produkte, einschließlich Handelsbots, Indikatoren und Plugins, werden von externen Entwicklern bereitgestellt und nur zu Informations- und technischen Zugriffszwecken verfügbar gemacht. cTrader Store ist kein Broker und erbringt keine Anlageberatung, persönlichen Empfehlungen oder eine Garantie für zukünftige Performance.


Preis
215
Verkäufe
677
Kostenlose Installationen