
VegaXLR - RSI and StochRSI Alerts
Indikator
16 käufe
Version 1.0, Apr 2025
Windows, Mac
5.0
Bewertungen: 3
Beschreibung
VegaXLR - RSI und StochRSI Alerts ist ein cTrader-Indikator, der Benachrichtigungen für RSI- und StochRSI-Ereignisse bereitstellt und Händler über Marktveränderungen informiert. Er benachrichtigt Benutzer über überkaufte/überverkaufte Niveaus, Kreuzungen der Mittellinie und Kreuzungen der K/D-Linien, alles mit anpassbaren Einstellungen.
Hauptmerkmale:
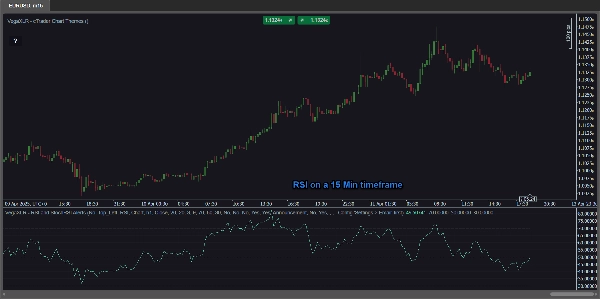
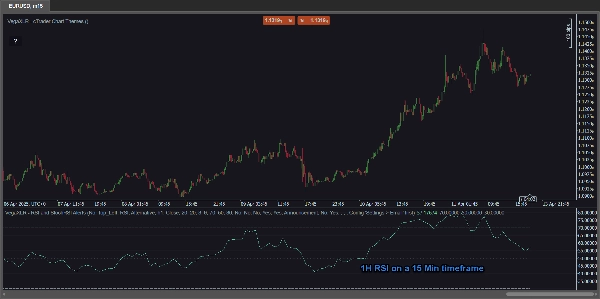
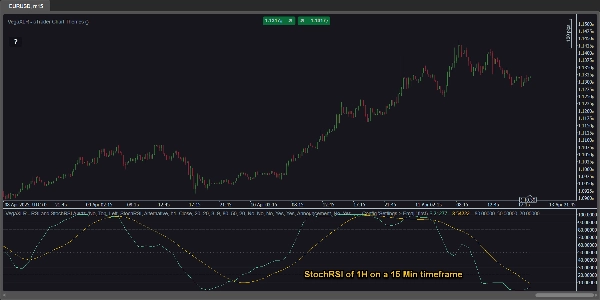
- Multi-Timeframe-Analyse: Einzigartige Ansicht der RSI- und StochRSI-Werte aus beliebigen Zeitrahmen direkt in Ihrem aktuellen Chart. Zum Beispiel analysieren Sie den 1-Stunden-RSI, während Sie ein 15-Minuten-Chart betrachten – ohne den Zeitrahmen Ihres Charts zu ändern!
- RSI- & StochRSI-Benachrichtigungen: Erhalten Sie Benachrichtigungen für:
-
- Überkaufte & überverkaufte Zustände
- Kreuzungen der Mittellinie (50%)
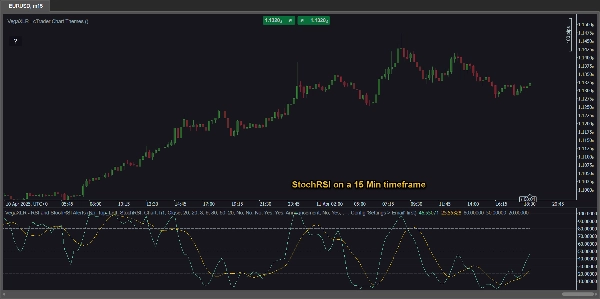
- Kreuzungen der K- und D-Linien (StochRSI)
- Anpassbare Einstellungen: Passen Sie die RSI-Quelle, Perioden, K/D-Werte und Alarmgrenzen für präzise Kontrolle an.
- Vielseitige Benachrichtigungen: Wählen Sie aus:
-
- cTrader-Popups
- Sound-Benachrichtigungen
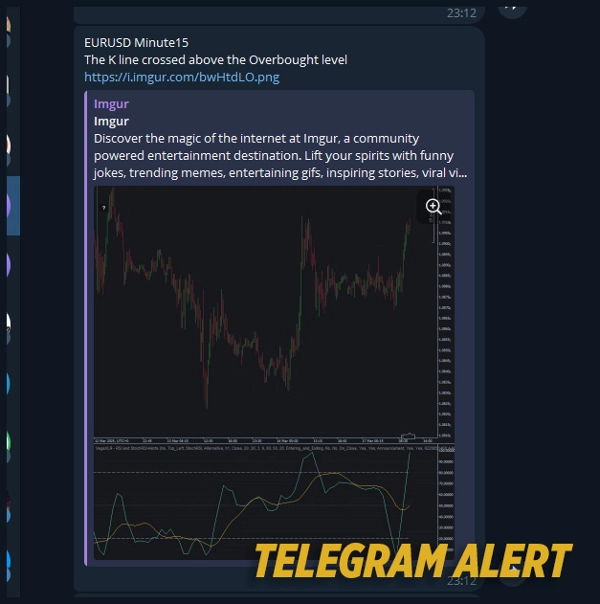
- Telegram-Benachrichtigungen (mit optionalen Chart-Screenshots)
- E-Mail-Benachrichtigungen
- Integrierte RSI- & StochRSI-Linien: Kein Bedarf an zusätzlichen Indikatoren – sie sind direkt integriert!
Sofortiger Zugriffsleitfaden: Ein praktischer Button im Chart öffnet das Benutzerhandbuch.
Zusammenfassung
KI-Zusammenfassung
VegaXLR - RSI and StochRSI Alerts is a cTrader indicator designed to monitor and notify traders of key RSI and StochRSI events. It provides alerts for overbought and oversold conditions, centerline (50%) crossovers, and K/D line crossovers within the StochRSI. The indicator supports multi-timeframe analysis, allowing users to view RSI and StochRSI values from any timeframe directly on their current chart without switching timeframes. Customizable settings enable adjustment of RSI source, periods, K/D values, and alert thresholds for tailored monitoring. Alert delivery options include cTrader popups, sound alerts, Telegram notifications (with optional chart screenshots), and email messages. The indicator integrates RSI and StochRSI lines internally, eliminating the need for additional indicators. An in-chart button provides instant access to the user manual for guidance. This tool assists traders in identifying precise market shifts and potential trade entry points based on momentum indicators.
Indikatorprofil
Kundenbewertungen
5.0
Bewertungen: 3
5 | 100 % | |
4 | 0 % | |
3 | 0 % | |
2 | 0 % | |
1 | 0 % |
Kundenbewertungen
April 27, 2025
Steady choice for testing for traders who use momentum confirmation. It gives value around oscillator setups, but strong trends can keep signals stretched. A clean test needs 25 oscillator signals, 2 timeframe confirmation and a clear 1R exit plan. The tool is useful when overbought or oversold is treated as context, not a command.
April 26, 2025
April 26, 2025
Good enough to inspect for oscillator setups. it gives a familiar read on overextension and momentum, especially when used for checking stretched conditions before entries. RSI style levels around 30 and 70 help, but I would add a 2 swing divergence check. The tool is useful when overbought or oversold is treated as context, not a command.
Diskussion
Häufig gestellte Fragen (FAQ)
RSI
Über den cTrader Store verfügbare Produkte, einschließlich Handelsbots, Indikatoren und Plugins, werden von externen Entwicklern bereitgestellt und nur zu Informations- und technischen Zugriffszwecken verfügbar gemacht. cTrader Store ist kein Broker und erbringt keine Anlageberatung, persönlichen Empfehlungen oder eine Garantie für zukünftige Performance.


Preis
229
Verkäufe
686
Kostenlose Installationen