
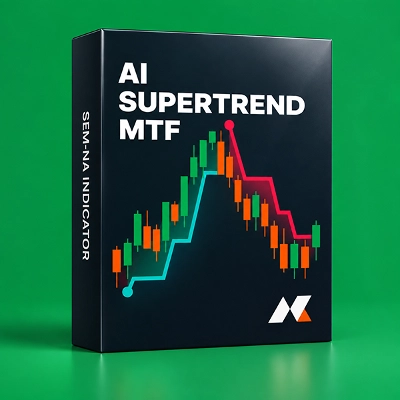
AI Supertrend MTF
Indikator
3 käufe
Version 1.0, Jul 2026
Windows, Mac

564.83M
Gehandeltes Volumen
9.79M
Pip-Gewinn
4
Verkäufe
Beschreibung
Überblick:
Müde davon, dass der traditionelle Supertrend-Indikator bei plötzlichen Marktveränderungen hinterherhinkt? AI Supertrend MTF definiert das Trendfolgen neu, indem er einen K-Nearest Neighbors (K-NN) Machine Learning-Algorithmus integriert. Er lernt kontinuierlich aus den jüngsten Kursbewegungen (RSI, ATR, Momentum) und passt seine Empfindlichkeit automatisch an, um falsche Signale in unruhigen Märkten zu eliminieren und gleichzeitig massive Ausbrüche sofort zu erfassen.
Hauptmerkmale:
- 🤖 Machine Learning Engine: Verwendet eine erweiternde Speicherbank und dynamische Merkmalsgewichtung, um echte Trends von Marktrauschen zu unterscheiden.
- 📊 Multi-Timeframe (MTF) Projektion: Sehen Sie das große Ganze! Projizieren Sie bis zu ZWEI höhere Zeitrahmen (z. B. 1H und Daily) direkt auf Ihr aktuelles niedrigeres Zeitrahmen-Chart. Entwickelt mit rigoroser bitweiser Logik, um NULL Nachzeichnen und kein Leaken von zukünftigen Daten zu garantieren.
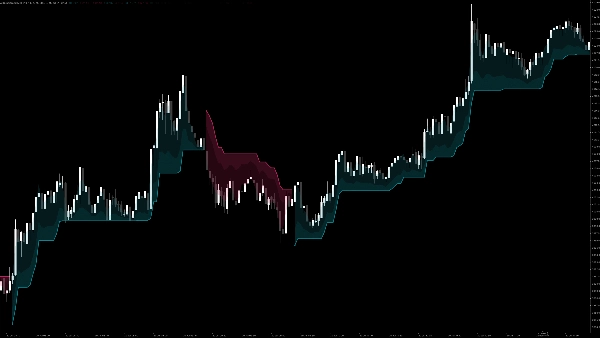
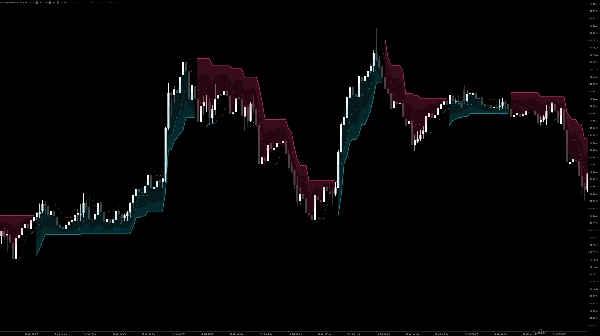
- ✨ Dynamische Leuchtende Wolken: Ein beeindruckendes visuelles Upgrade. Zeigt sanfte, unaufdringliche 3-Schicht-Verlaufswolken an, um die Stärke und Unterstützungs-/Widerstandszonen des aktuellen Trends visuell darzustellen.
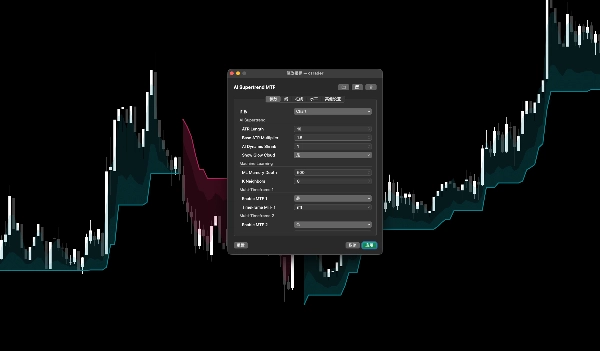
- ⚙️ Hochgradig anpassbar: Passen Sie die AI-Speichertiefe, K-Nachbarn und MTF-Granularitäten direkt im nativen Parameterfenster von cTrader an.
Anleitung zur Verwendung (Benutzerhandbuch):
- An Chart anhängen: Wenden Sie den Indikator auf Ihren bevorzugten Zeitrahmen an. Die Haupttrendlinie zeigt sofort die aktuell von der KI berechnete Richtung an.
- MTF aktivieren (optional): Scrollen Sie in den Einstellungen zu
Multi-Timeframe 1undMulti-Timeframe 2. Aktivieren Sie das Kontrollkästchen "Enable" und wählen Sie Ihre gewünschten höheren Zeitrahmen aus. Es erscheinen gestrichelte Linien, die den Makrotrend anzeigen. - Handelsstrategie:
-
- Kaufsignal: Wenn die Haupttrendlinie auf Cyan (unter dem Preis) wechselt UND die MTF-Höherzeitlinien ebenfalls Cyan sind (Trend-Ausrichtung).
- Verkaufssignal: Wenn die Haupttrendlinie auf Rot (über dem Preis) wechselt UND die MTF-Höherzeitlinien ebenfalls Rot sind.
- Ausgang: Verwenden Sie die leuchtenden Wolkenbänder als dynamische Trailing-Stop-Loss-Niveaus.
Zusammenfassung
KI-Zusammenfassung
AI Supertrend MTF is a trend-following indicator that integrates a K-Nearest Neighbors (K-NN) machine learning algorithm to reduce lag and false signals typical of traditional Supertrend indicators. It continuously learns from recent price action metrics including RSI, ATR, and momentum, adapting its sensitivity to distinguish true trends from market noise and to capture breakouts promptly.
Key features include multi-timeframe (MTF) projection, allowing users to overlay trend information from up to two higher timeframes onto the current chart without repainting or future data leaks. The indicator visually represents trend strength and support/resistance zones through dynamic, three-layer glowing clouds. Users can customize AI memory depth, K-neighbors, and MTF settings via the native parameter panel.
To use, apply the indicator to any timeframe to see the AI-calculated trend direction. Optional MTF lines display macro trends from higher timeframes. Buy and sell signals are generated when the main trendline and MTF lines align in color (cyan for buy, red for sell). The glowing cloud bands serve as dynamic trailing stop-loss levels.
This indicator supports visualization, signals, and filtering functions, and requires bar, tick, and volume data inputs. It is categorized under trend indicators and incorporates RSI and ATR for momentum and volatility analysis.
Indikatorprofil
Indikatorkategorie
Trend
Ausgabetyp
Visualisierung
Filter
Signale
Datenanforderungen
Nur Balken
Tick-Daten
Volumen
Unterstützte Signale
Durchbrechen
Ausbruch
Wendepunkt
Trendstärke
Volatilität
Level – Durchbrechen
Diskussion
Kundenbewertungen
0.0
Bewertungen: 0
Kundenbewertungen
Bisher gibt es keine Bewertungen für dieses Produkt. Haben Sie es schon ausprobiert? Dann können Sie die erste Person sein, die andere darüber informiert!
Häufig gestellte Fragen (FAQ)
Supertrend
RSI
ATR
Über den cTrader Store verfügbare Produkte, einschließlich Handelsbots, Indikatoren und Plugins, werden von externen Entwicklern bereitgestellt und nur zu Informations- und technischen Zugriffszwecken verfügbar gemacht. cTrader Store ist kein Broker und erbringt keine Anlageberatung, persönlichen Empfehlungen oder eine Garantie für zukünftige Performance.
Mehr von diesem Autor





Preis
564.83M
Gehandeltes Volumen
9.79M
Pip-Gewinn
4
Verkäufe