

Money Flow Profile
Indicator
Version 1.0, Jul 2026
Windows, Mac

531.49M
Traded volume
9.76M
Pips won
4
Sales
Description
📊 Money Flow Profile
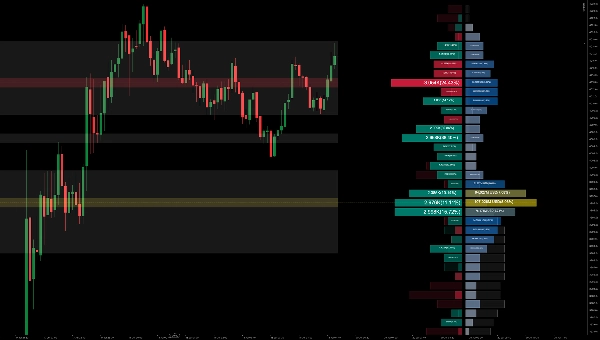
The Money Flow Profile is an advanced charting tool that measures the traded volume or the money flow at all price levels on the market over a specified time period. It highlights the relationship between the asset's price and the willingness of traders to buy or sell, allowing you to:
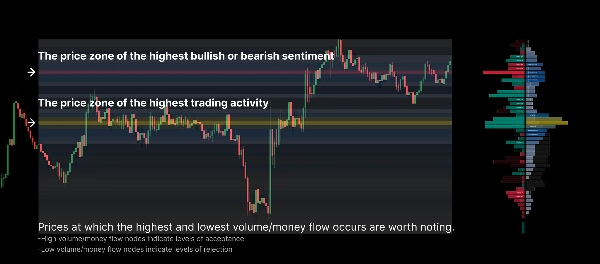
- Reveal Key Price Levels: Easily identify volume clusters and high-liquidity nodes like the Point of Control (POC).
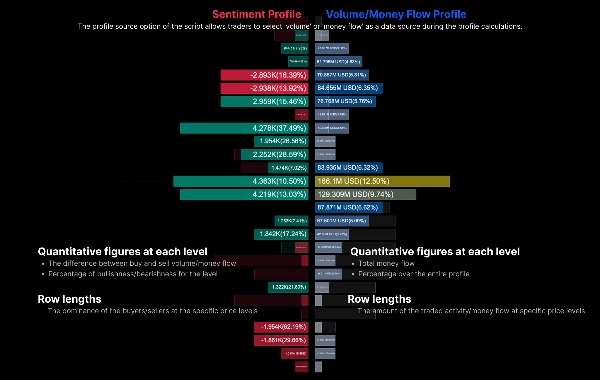
- Analyze Market Sentiment: By displaying a Sentiment Profile on the left and a Volume Profile on the right, it determines whether buyers or sellers are dominating at each specific price level.
- Cross-Period Comparison: Directly compare the current profile with the previous period's ghost profile to observe shifts in the center of gravity of the market.
⚙️ Core Parameters & Usage Guide
1. General Settings
- Lookback Length / Fixed Range: Defines the number of historical bars used to calculate the profile (e.g., the last 200 bars).
- Data Source:
1 = Volume: Calculates the profile based on traditional tick/trading volume.2 = Money Flow: Incorporates price depth to calculate money flow distribution.
2. Profile Settings
- Row Resolution (Rows): Determines the granularity of the vertical axis. A higher number (e.g., 50-100) results in a more detailed profile.
- Profile Width & Horizontal Offset: Adjusts how wide the profile is drawn (as a percentage) and how far to the right it is offset, preventing it from overlapping with the current candlestick.
3. Sentiment & Display
- Sentiment Polarity:
1 = Candle: Determines bullish/bearish sentiment based purely on the candle's open and close (polarity).2 = Buy/Sell Pressure: Uses a more precise calculation factoring in wicks and the close relative to the high/low.
- Show Sentiment Profile / Volume Profile: Independent toggles to display the net sentiment profile (Left) and the main volume profile (Right).
- Show Previous Period: When enabled, it draws a background "Ghost Bar" profile representing the exact same time window from the previous period. Great for tracking support/resistance shifts.
4. Extended Area Display
- Show Heatmap: Projects the profile density across the entire calculation period as a background heatmap. You can choose to project either "Volume" or "Sentiment".
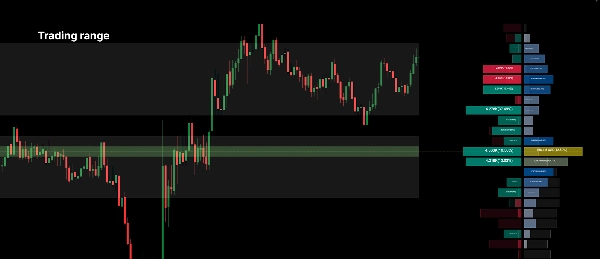
- Show Value Area: Highlights the core price range where the majority of trading volume occurred. The threshold is customizable (e.g., 70%).
- Show POC Zone: Automatically draws a horizontal line and zone at the Point of Control (the price level with the highest volume) for the selected range.
💡 Practical Trading Tips:
- Look for High Volume Nodes (Peaks) to act as strong support or resistance levels.
- Look for Low Volume Nodes (Valleys), as the price tends to move quickly through these low-liquidity zones.
- Use the Previous Period Ghost Profile: If the current POC (yellow line) is forming higher than the previous period's POC, it indicates that value consensus is shifting upwards, which is generally a bullish signal.
Summary
AI summary
Money Flow Profile is an advanced indicator that maps traded volume and market sentiment across price levels over a specified time period. It visualizes the relationship between price and trader activity, highlighting key liquidity zones such as volume clusters and the Point of Control (POC). The tool displays a Sentiment Profile on the left and a Volume Profile on the right, enabling users to assess whether buyers or sellers dominate at each price level. It supports direct comparison with the previous period’s profile via a ghost overlay to track shifts in market value consensus.
Core configurable parameters include lookback length, data source selection (volume or money flow), row resolution for vertical granularity, profile width and offset, and sentiment polarity calculation methods (candle-based or buy/sell pressure). Display options allow toggling of sentiment and volume profiles, previous period overlays, heatmaps of volume or sentiment density, value area highlighting, and automatic POC zone marking.
The indicator is designed to help identify strong support and resistance levels at high volume nodes and anticipate rapid price movements through low volume nodes. It supports detailed volume and sentiment analysis to inform trading decisions based on liquidity and market structure.
Core configurable parameters include lookback length, data source selection (volume or money flow), row resolution for vertical granularity, profile width and offset, and sentiment polarity calculation methods (candle-based or buy/sell pressure). Display options allow toggling of sentiment and volume profiles, previous period overlays, heatmaps of volume or sentiment density, value area highlighting, and automatic POC zone marking.
The indicator is designed to help identify strong support and resistance levels at high volume nodes and anticipate rapid price movements through low volume nodes. It supports detailed volume and sentiment analysis to inform trading decisions based on liquidity and market structure.
Indicator profile
Indicator category
Volume
Output type
Visualisation
Data requirements
Volume
DoM
Bars only
Tick data
Supported signals
Breakout
Trend strength
Reversal
Volatility
Level touch
Level break
Customer reviews
0.0
Reviews: 0
Customer reviews
No reviews for this product yet. Already tried it? Be the first to tell others!
Discussion
FAQ
Key Levels
Volume
Products available through cTrader Store, including trading bots, indicators and plugins, are provided by third-party developers and made available for informational and technical access purposes only. cTrader Store is not a broker and does not provide investment advice, personal recommendations or any guarantee of future performance.
More from this author



















Price
531.49M
Traded volume
9.76M
Pips won
4
Sales