
Description
MACD Based Price Forecasting
Overview
This indicator breaks through the limitations of traditional MACD by moving beyond historical analysis, innovatively introducing historical memory and statistical algorithms to forecast future price action.
Core Mechanics:
- Historical Trend Memory: The indicator records the price displacement of past MACD trends (both bullish and bearish) relative to their starting points, building a statistical database of up to 50 recent trends.
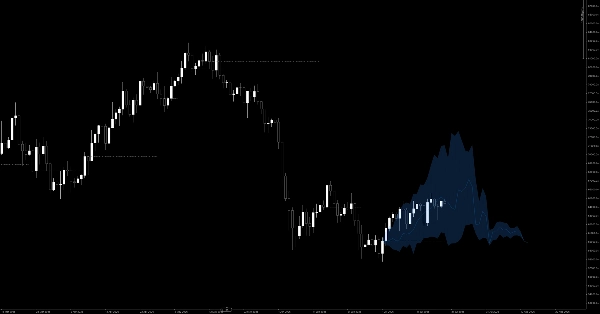
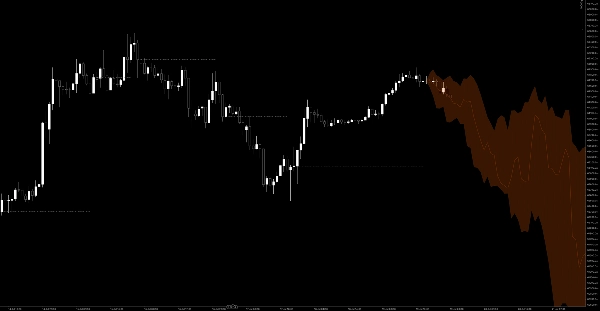
- Probability Forecasting Fan: When a new MACD crossover occurs (either crossing the zero-line or the signal line), the indicator retrieves data from the historical memory. It calculates the 20%, 50%, and 80% percentiles of price changes and projects a probability forecasting fan for the next 100 bars on the right side of the chart.
- Dynamic Signal Area Cloud: It marks the "Reference Price" where the trend reversal originated. When the real-time price is above this reference price in an uptrend, it paints a green cloud area; conversely, it paints a red cloud in a downtrend. This provides an immediate visual confirmation of the actual bullish or bearish momentum.
(Note: This indicator features highly optimized graphic rendering, utilizing seamless polygon blending for clear visual zones and a refined discontinuous reference line for an incredibly clean chart experience.)
Trading Rules & User Guide
This indicator goes beyond simple "buy/sell on crossover" signals—it provides you with a probabilistic roadmap for your trades.
1. Finding Entries (Trend Confirmation)
- Long Entries: When a bullish MACD crossover occurs, a blue forecasting fan projecting upwards will appear on the right. Do not rush in blindly. Wait to see if the price stabilizes above the dash-dot line (Reference Price) and a green bullish cloud starts to expand. This confirms that the current momentum matches the bullish historical statistics, providing a solid opportunity to buy the dip.
- Short Entries: When a bearish MACD crossover occurs, an orange forecasting fan projecting downwards will appear. Look for the price to stay below the reference line with an expanding red bearish cloud to confirm a short entry on a pullback.
2. Setting Take Profit Targets
The forecasting fan acts as an excellent dynamic take-profit guide:
- Target 1 (The Middle Line): The middle line inside the fan represents the 50% historical percentile (the average trajectory). When the price touches this line, it means the current move has achieved the historical average, making it an ideal spot to take partial profits.
- Target 2 (The Fan's Outer Edges): The upper boundary (80% percentile) or the lower boundary (20% percentile) represents historical extremes. If the price reaches these edges, momentum is heavily exhausted, and a reversal or deep pullback is highly probable. Consider closing the entire position.
3. Scientific Stop Loss Placement
- The grey dashed line (Reference Price) acts as the baseline for every trend.
- When going long, place your stop loss slightly below this grey line. If the price breaks down through the reference price and the green cloud disappears, it means the actual price action has invalidated the historical bullish probability. The trend setup has failed, and you should cut your losses immediately.
4. Ranging Market Filter
- If an MACD crossover occurs but the projected forecasting fan appears very flat or contracted, it means that historically, similar crossovers only resulted in choppy, sideways action.
- When you see a flat fan, sit on your hands and avoid trading. Wait for the next cycle where the fan shows clear upward or downward expansion.
Summary
Key features include a probability forecasting fan that projects 20%, 50%, and 80% price change percentiles for the next 100 bars following a MACD crossover. The indicator visually displays this fan on the chart, with blue fans for bullish signals and orange for bearish. A dynamic signal area cloud highlights momentum: green for confirmed uptrends above a reference price and red for downtrends below it.
Trading guidance involves waiting for price confirmation above or below the reference price and cloud before entering long or short positions. The forecasting fan also serves as a dynamic take-profit guide, with the middle line representing average historical moves and outer edges indicating potential trend exhaustion. Stop-loss placement is recommended just beyond the reference price line to manage risk.
Additionally, the indicator filters ranging markets by identifying flat or contracted fans, signaling sideways price action and advising traders to avoid entering trades during such periods. The indicator supports visualization outputs and is tagged under MACD and momentum indicators.