

Description
👻 PHANTOM TREND MOMENTUM — INSTITUTIONAL TREND, MOMENTUM & MTF RADAR SUITE
Phantom Trend Momentum is a complete, institutional-grade trend and momentum trading indicator engineered for cTrader. By combining double-smoothed price projection (EMA + WMA), volatility-normalized momentum (Wilder's ATR), an automated Neutral Consolidation Zone Detector, and a real-time 6-Timeframe Trend Dashboard, it gives traders crystal-clear Entry, Exit, Stop Loss, and Multi-Target Take Profit (TP1, TP2, TP3) levels directly on the chart.
🌍 UNIVERSAL MULTI-ASSET COMPATIBILITY
Fully optimized and tested to work seamlessly across ALL Markets:
• 💱 Forex: All Major, Minor & Exotic Currency Pairs (EURUSD, GBPUSD, USDJPY, GBPJPY, etc.)
• 📊 Indices: US30, NAS100, SPX500, GER40, UK100, JP225, etc.
• 🥇 Commodities & Metals: Gold (XAUUSD), Silver (XAGUSD), Crude Oil (WTI/Brent), Natural Gas
• ₿ Cryptocurrencies: Bitcoin (BTCUSD), Ethereum (ETHUSD), Solana (SOLUSD) & Altcoins
━━━━━━━━━━━━━━━━━━━━━━━━━━━━━━━━━━━━━━━━
🔍 1. WHAT MARKET DATA & CONDITIONS THE INDICATOR ANALYSES
• 📈 Double-Smoothed Price Projection (oda, hda, lda, cda): Filters out market noise and fake wicks by projecting the relationship between live OHLC prices and their Exponential Moving Averages (EMA), then smoothing the differential through a Weighted Moving Average (WMA).
• ⚡ ATR-Normalized Momentum Velocity: Measures the exact bar-to-bar rate of change of the smoothed price curve divided by Wilder’s Average True Range (ATR). This ensures momentum thresholds adapt automatically to any asset's volatility—from low-volatility Forex pairs to explosive Gold (XAUUSD) and Bitcoin (BTCUSD) moves.
• 🧱 Range & Low-Body Consolidation Detection (Neutral Zone): Continuously monitors candle body-to-ATR ratios and price range compression to detect choppy, sideways markets (NEUTRAL ZONE) and automatically block low-probability trades.
• 🖥️ Higher-Timeframe Trend Confluence: Simultaneously tracks Trend Direction, Market Zone (Active vs. Neutral), Momentum strength, and 55 EMA alignment across M5, M15, M30, H1, H4, and D1.
━━━━━━━━━━━━━━━━━━━━━━━━━━━━━━━━━━━━━━━━
🎯 2. HOW TO INTERPRET SIGNALS & VISUAL ELEMENTS
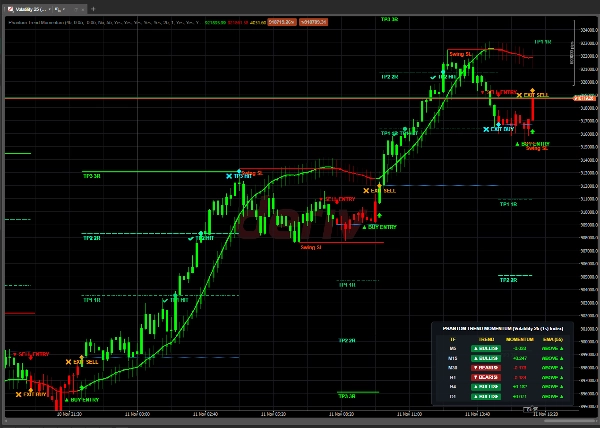
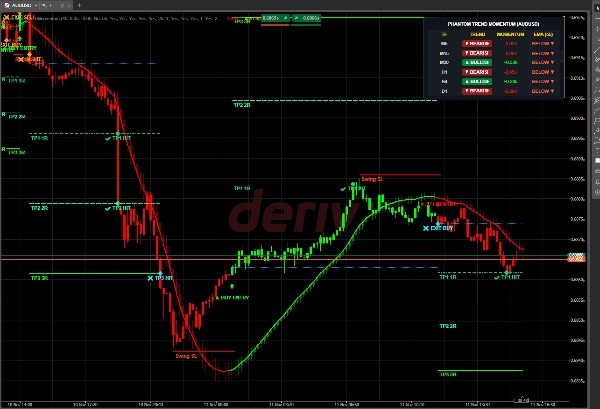
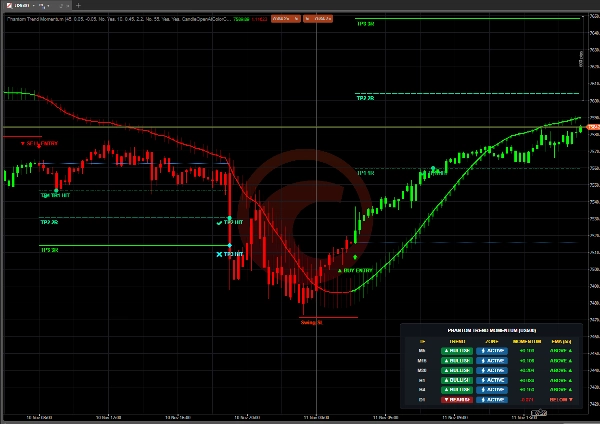
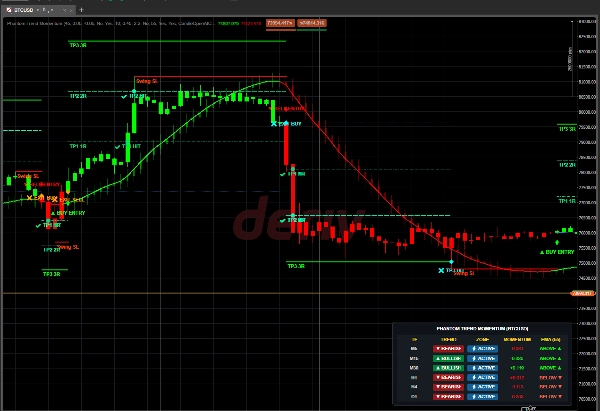
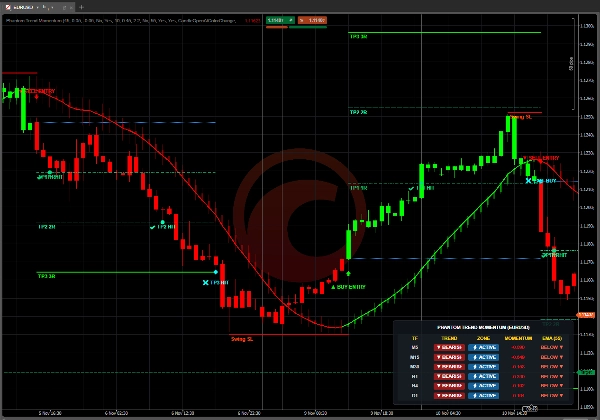
• 🟢 Green Smoothed Curve & Candles (Bullish Trend): Momentum has surged above the Long Threshold (+0.05). Look for ▲ BUY ENTRY signals.
• 🔴 Red Smoothed Curve & Candles (Bearish Trend): Momentum has dropped below the Short Threshold (-0.05). Look for ▼ SELL ENTRY signals.
• ⚪ Silver Curve & Amber Shaded Box (NEUTRAL ZONE): The market is consolidating in a tight range with small candle bodies. New trade signals are automatically paused until a clean breakout occurs.
• 🚀 ▲ BUY ENTRY / ▼ SELL ENTRY Labels: Plotted when a fresh momentum trend flip aligns with the optional 55 EMA Trend Filter.
• 🛡️ Automated Swing SL & TP1 / TP2 / TP3 Lines: Every valid entry automatically plots:
- Swing SL (Red Line): Placed below the recent Swing Low (for Buys) or above the recent Swing High (for Sells) plus a customizable pip buffer.
- TP1 (1R), TP2 (2R) & TP3 (3R) (Green Lines): Dynamic Risk-to-Reward targets with real-time ✔ TP1 HIT, ✔ TP2 HIT, and ✖ TP3 HIT markers.
• ⚡ ✖ EXIT BUY / ✖ EXIT SELL (Immediate Color-Flip Exit): Plotted immediately the moment the smoothed trend line flips color against an active trade—no need to wait for a lagging candle close!
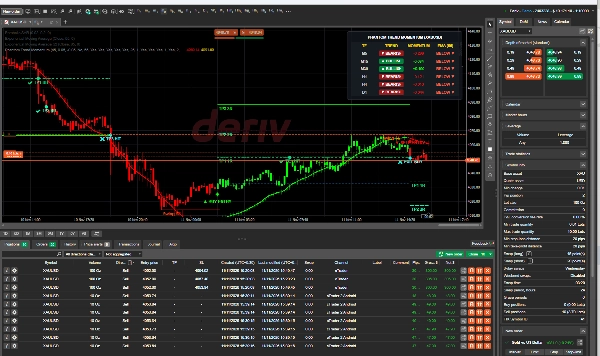
• 📊 5-Column Multi-Timeframe Dashboard: Displays live TF (M5–D1), TREND (▲ BULLISH / ▼ BEARISH / ◆ NEUTRAL), ZONE (⚡ ACTIVE / ⬛ NEUTRAL), MOMENTUM, and EMA (55) status in your chosen chart corner.
━━━━━━━━━━━━━━━━━━━━━━━━━━━━━━━━━━━━━━━━
⚙️ 3. KEY SETTINGS & PARAMETERS
🔹 Phantom Trend Momentum Group:
• Lookback (Default: 45): Period for the double-smoothed EMA/WMA engine and Wilder's ATR.
• Long Threshold (0.05) / Short Threshold (-0.05): Sensitivity levels required to trigger a Bullish or Bearish trend shift.
🔹 Neutral Consolidation Zone Group:
• Enable Neutral Zone Filter: Toggles automatic sideways range detection and trade avoidance.
• Draw Neutral Zone Box on Chart: Highlights consolidation ranges with a shaded box.
• Consolidation Lookback (10), Max Body / ATR Ratio (0.45), Max Range / ATR Ratio (2.2): Fine-tune how strictly sideways low-body markets are filtered.
🔹 EMA Trend Filter Group:
• Enable EMA Trend Filter & EMA Filter Period (55): Ensures Buy signals only trigger above the EMA and Sell signals only trigger below the EMA.
🔹 Entry & Stop Loss (SL) Group:
• Show Buy/Sell Entry Labels & Show Exit Labels: Toggle on-chart signal badges.
• Exit Label Position: Choose between CandleOpenAtColorChange, SmoothedLineColorFlip, or ExactThresholdTriggerPrice.
• Immediate Opposite Color Exit: Triggers exit markers immediately when the line changes color.
• Swing High/Low Lookback (25) & SL Buffer (Pips): Controls automatic structural Stop Loss placement.
🔹 Take Profit (TP) Drawings Group (Boolean Controls):
• Enable TP Drawings (Master): Master switch for all TP lines and markers.
• Individual Boolean Toggles & RR Multipliers for TP1 (1.0R), TP2 (2.0R), and TP3 (3.0R).
🔹 Visuals & Dashboard Group:
• Customize candle coloring, smoothed overlay candles, dashboard corner placement (TopRight, TopLeft, BottomRight, BottomLeft), and sound alerts.
━━━━━━━━━━━━━━━━━━━━━━━━━━━━━━━━━━━━━━━━
💡 4. TYPICAL USE CASES & TRADING SCENARIOS
• 🔥 Intraday Momentum & Breakout Trading (M5 / M15 / M30): Wait for price to break out of a NEUTRAL ZONE with an ▲ BUY ENTRY or ▼ SELL ENTRY while H1 and H4 on the MTF Dashboard show ▲ BULLISH or ▼ BEARISH + ⚡ ACTIVE.
• 💰 Multi-Target Scaling Out: Lock in partial profits at TP1 (1R) and TP2 (2R), move your Stop Loss to breakeven, and ride the runner to TP3 (3R) or until an ✖ EXIT color-flip marker appears.
• 🌊 Trend Riding on Gold (XAUUSD), Indices (NAS100/US30) & Crypto (BTCUSD): Use the smoothed cda curve as a dynamic trailing guide to stay in strong impulse waves without getting shaken out by minor pullbacks.
━━━━━━━━━━━━━━━━━━━━━━━━━━━━━━━━━━━━━━━━
👤 5. WHO THIS INDICATOR IS BEST SUITED FOR
• 🎓 Beginner Traders: Benefit from clear, non-cluttered BUY/SELL ENTRY labels, automatic Swing SL placement, and pre-calculated TP1, TP2, and TP3 targets without complex manual charting.
• 🧠 Intermediate & Pro Traders: Leverage the 6-timeframe momentum radar, EMA trend filter, and customizable ATR consolidation ratios to filter out choppy ranges and trade high-probability institutional setups.
• ⏱️ All Trading Styles: Suitable for Scalpers (M1–M5), Day Traders (M15–H1), and Swing Traders (H4–D1).
━━━━━━━━━━━━━━━━━━━━━━━━━━━━━━━━━━━━━━━━
⚠️ 6. IMPORTANT LIMITATIONS, USAGE NOTES & RISK DISCLAIMER
• ⏳ Multi-Timeframe Data Sync: When first attaching the indicator to a chart, cTrader downloads historical bars for M5, M15, M30, H1, H4, and D1. Allow 1–2 seconds for all dashboard rows to update from LOADING to live status.
• 📰 High-Impact News Events: During major macroeconomic releases (e.g., NFP, CPI, FOMC), sudden price gaps or spread widening can exceed standard ATR thresholds. Avoid opening new positions minutes before high-impact news.
• 🔧 Parameter Optimization: Default settings (Lookback: 45, Thresholds: ±0.05) work out of the box across Forex, Gold, Indices, and Crypto. Scalpers on M1/M5 can reduce Lookback (25–35) for faster entries, while Swing Traders on H4/D1 can increase thresholds (±0.07) for longer-term trends.
• 🛡️ Risk Disclaimer: Trading Forex, CFDs, Indices, Commodities, and Cryptocurrencies carries a high level of risk and may not be suitable for all investors. Past performance of any indicator or trading system is not indicative of future results. Always use proper risk management (1%–2% risk per trade) and test on a demo account before trading live.
Summary
Discussion
Customer reviews
FAQ












Price