Brokers & props
For business
00
Days
:
00
Hours
:
00
Minutes
:
00
Seconds
Order_Block_Arrow_
Indicator
1 purchases
Version 1.0, Oct 2024
Windows, Mac
Since 06/10/2024
Sales
1
"Order_Block_Arrow_" uploaded image"Order_Block_Arrow_" uploaded image"Order_Block_Arrow_" uploaded image"Order_Block_Arrow_" uploaded image

Order Block - Market Structure Signals

This powerful instrument, developed by professional traders, has already proven its effectiveness on real trading accounts.

Key advantages:

  1. Versatility: works on any instruments, markets, and timeframes (forex, crypto, stocks, bonds, futures).
  2. Precision: shows best results on tick charts, filtering out quick impulses during strong market movements. Also works well on standard timeframes.
  3. Flexibility of settings: allows you to adapt the indicator to your trading style and preferences.
  4. Visual clarity: clearly displays market structure breakdown levels, signals, and support/resistance zones (OrderBlock).

Main functions:

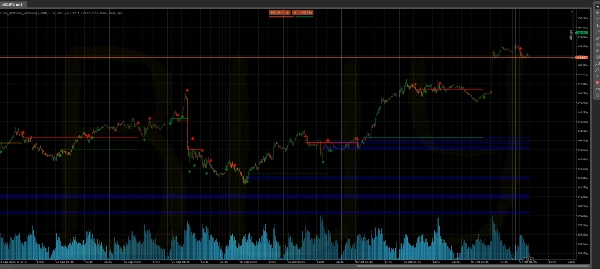
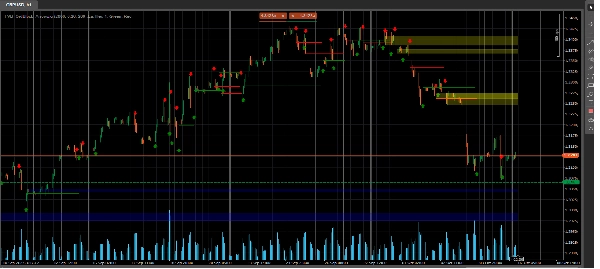
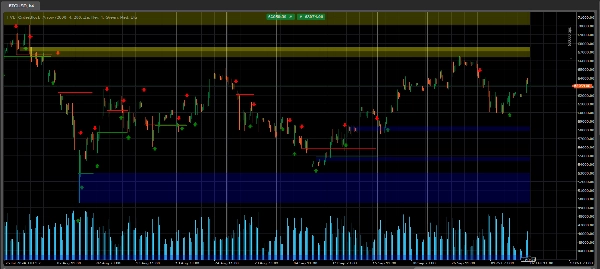
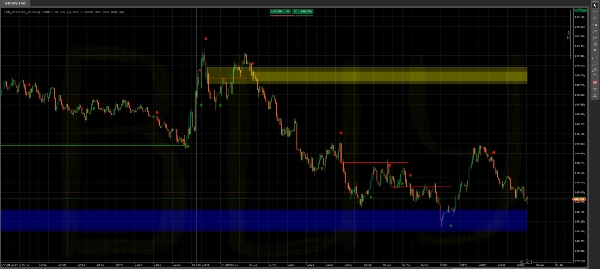
  • Dynamic calculation and display of OrderBlock zones
  • Entry signals (red and green arrows)
  • Display of probable future trend movement (optional)
  • Adjustable block transparency
  • Option to remove completed zones

Always consider the market context!

Settings:

 Bars History - number of bars for calculation (if too many - may load the computer). Default is 2000 bars.

 Deviation % Zigzag - main parameter - calculation from zigzag. Adjusted depending on timeframe and instrument Block 

Transparency 0-250 - transparency of blocks Delete Old/Broken Boxes - whether to delete old blocks 

Delete Arrows - do not show signal arrows Arrow Distance (ATR multiplier) - distance from bar to arrow in ATR ........

Delete Dots - disable drawing of dots (controversial function - dots show probable future trend movement)

On the chart: Red and green lines - market structure breakdown levels Red and green arrows - indicator signal Bands - OrderBlock zones - support and resistance. They are dynamically calculated and removed when completed (option to keep them on the chart)

Important: The indicator code is protected by copyright.

0.0
Reviews: 0
Customer reviews
No reviews for this product yet. Already tried it? Be the first to tell others!
ATR
Stocks
Forex
Signal
Crypto

You may also like

Indicator
NAS100
RSI
NZDUSD
+13
DeepScalp Pro Ai
🦅 Institutional Trading System with AI Gatekeeper. Detect Order Blocks, Volume Profile & PUMP/DUMP signals in real-time
Indicator
NAS100
Indices
NZDUSD
+9
Volumatic Fair Value Gaps
📊 Detects Fair Value Gaps with lower timeframe volume analysis & clean dashboard 🟢🔴
Indicator
VWAP
RSI
Breakout
+7
Anchored VWAP by LudwigICT
📈 Anchored VWAP with auto High/Low, session resets, Daily VWAP & TWAP — precise, Pine-accurate port.
Indicator
Breakout
Scalping
SMC
Bubble Indicator 2.0
Delta Peak Bubbles is a tick‑chart overlay for cTrader that highlights the strongest momentum spikes.
Indicator
Grid
Indices
Breakout
+9
crossover 1
Crossover Buy and Sell Alerts and signals
Indicator
NAS100
NZDUSD
Breakout
+19
ICT Concepts from TradingView
Smart ICT Concepts indicator from TV: combining FVGs, Liquidity, Order Blocks, and Market Structure in one tool.
Indicator
NAS100
NZDUSD
XAUUSD
+14
VWAP Touch Pro V4
Professional Hybrid VWAP V4.0 Wirth 4 Calcination Modes, Auto-Anchorage, MTF Filters, and ATR Volatilste Bands.
VWAP
Track VWAP for Asia, London, NY, Sydney, Daily, Weekly, Monthly & Custom Sessions. Perfect for FX & intraday trading!
Indicator
RSI
Breakout
Supertrend
Leverage Liquidation Map
📊 Liquidation Map: Potential areas where highly leveraged investors might face liquidations.
Indicator
NAS100
NZDUSD
XAUUSD
+12
Footprint Chart_noSourceCode
"Footprint Chart: Visualize bid-ask volume inside candles for clearer order flow and market depth insights."
Indicator
Indices
RSI
Prop
+5
MultiScalpScorePRO
🔍 MultiScalpScorePRO – Powerful real-time scoring system combining indicators for ultra-precise scalping signals.
Indicator
NZDUSD
Breakout
XAUUSD
+7
Support Resistance
Utilize support and resistance levels across various timeframes, including large, range, and tick charts