Indicator
Grid
NAS100
NZDUSD
Breakout
XAUUSD
Commodities
Martingale
Forex
Signal
EURUSD
GBPUSD
BTCUSD
Indices
Prop
Stocks
Crypto
USDJPY
Scalping
RangeBoxLevel
"RangeBoxLevel" logo
5.0
23/09/2025
18
Desktop
"RangeBoxLevel" uploaded image"RangeBoxLevel" uploaded image"RangeBoxLevel" uploaded image"RangeBoxLevel" uploaded image"RangeBoxLevel" uploaded image"RangeBoxLevel" uploaded image"RangeBoxLevel" uploaded image"RangeBoxLevel" uploaded image"RangeBoxLevel" uploaded image

This technical analysis indicator provides information on market sentiment, trend and price levels. It uses data such as Volume, Open_Close, Chaikin Volatility and Chaikin Money Flow to calculate market sentiment. It also allows you to adjust spreads, detect trends and visualize price levels and pips. It is a useful tool to identify the prevailing force in the market, anticipate price movements and improve trading decision making.

In the description, I indicate the important parameters; the rest are style configurations such as color, line type, and font size.
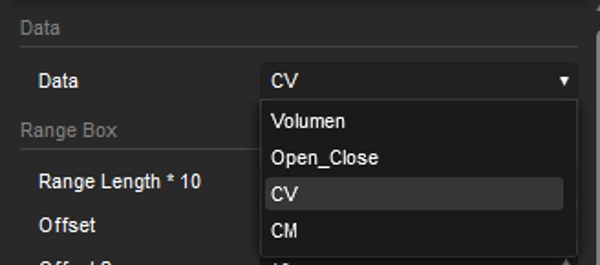


Data

Sentiment calculations are based on selecting from Volume, Open_Close, Chaikin Volatility, and Chaikin Money Flow.

Range Length * 10

The value indicates the number of candles (periods) the calculation is based on – the value is multiplied by 10.

Add Zoom

To keep the chart centered, this also helps to consider situations like consolidation and trend changes.

Margin

Allows adjusting the top and bottom margins to improve visualization.
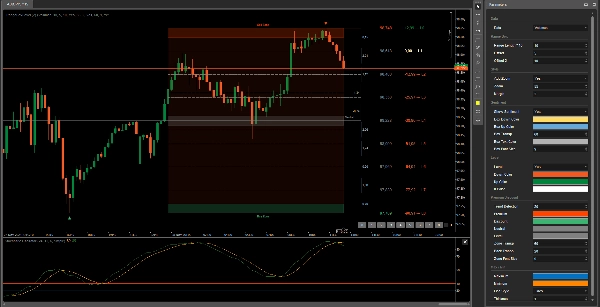
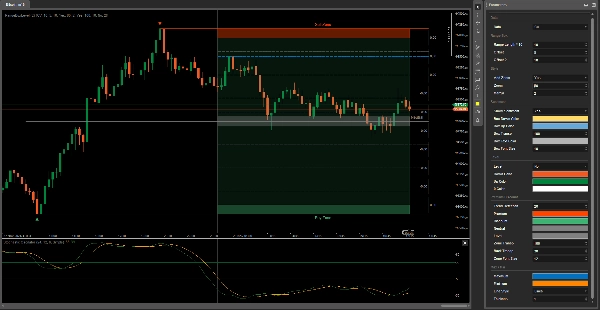
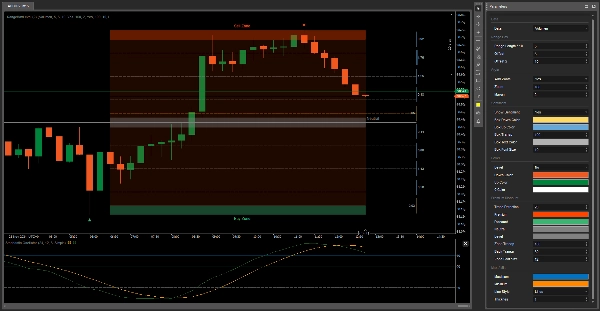
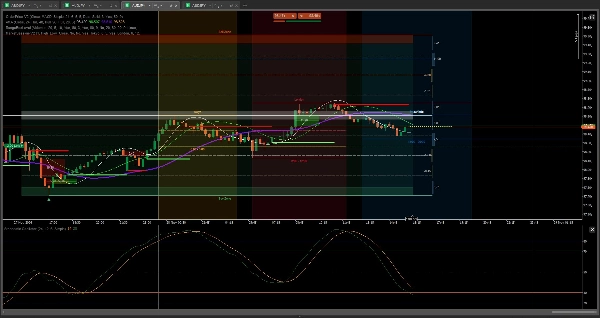
Show Sentiment

Sentiment indicates which force is stronger in the market at the moment. If the yellow bars increase in size, it means there are more sellers, and vice versa. If you do not wish to see the sentiment visualization, you can hide it on the right side.

Level

This is an extra feature that can be used as a reference for prices and pips at each level. When you select a level where you want to place the buy order, it indicates the pips at each level that the price can reach.

Trend Detection

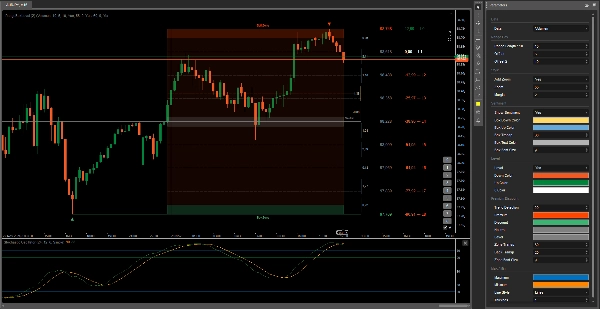
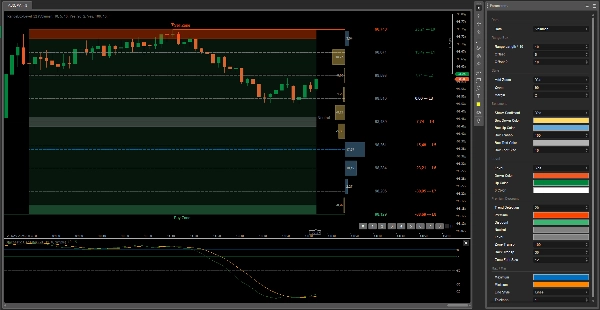
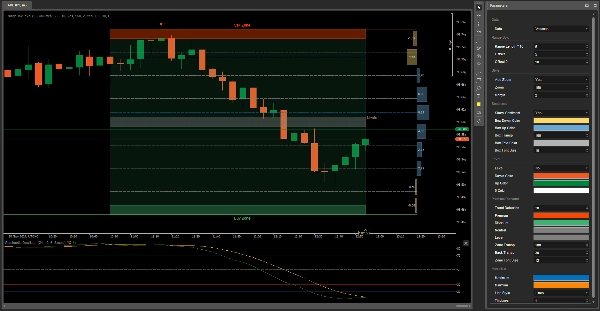
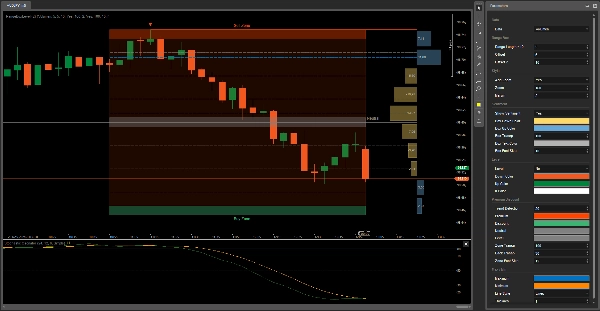
Depending on the trend of the asset, the background of the Range Box changes: green if it is bullish and red if it is bearish.

Max / Min

These are the blue and yellow lines that change their position according to the prediction of where the price might go. The Range Box is divided into 9 sections to help determine the price inflection points, serving as a Fibonacci Retracement.


With additional tools like

OrderPrice V3 https://ctrader.com/products/397

NTMPICLL https://ctrader.com/products/327

Range Box Level https://ctrader.com/products/245

Or RangeBoxFibonacci https://ctrader.com/products/526

Market Session https://ctrader.com/products/94

MacdVolume https://ctrader.com/products/267

4MA https://ctrader.com/products/247

You will be invincible

Good luck 😀

5.0
Reviews: 1
5
100 %
4
0 %
3
0 %
2
0 %
1
0 %
Customer reviews
August 18, 2025
Combines volume, open-close and Chaikin volatility to define meaningful price levels. Visually clear and flexible settings. Cons: No tooltips or alerts. Lacks template saving and level history. Needs confirmation via PA or volume.
More from this author
Indicator
Indices
Prop
Commodities
+3
4MA
This indicator consists of 3 moving averages that can be configured to your liking, from the type of moving average....
Indicator
NAS100
NZDUSD
XAUUSD
+10
MarketSession-MX
😎Read the description before purchasing💩
VWAP-Free
VWAP only timeframe
Indicator
Stocks
Forex
MACD
MACDVolume
😎Read the description before purchasing💩
cBot
Commodities
MACD
SparrowBot-FreeTrial-V2
This bot can automatically generate buy and sell orders based on three specific Fixed bugs
Indicator
Grid
NAS100
NZDUSD
+15
RangeBoxFibonacci
With this Fibonacci retracement indicator, traders have full control over the retracement levels displayed on the chart.
Indicator
NAS100
NZDUSD
XAUUSD
+11
SessionOne
Session One is a tool for marking from to, useful if you've set the hours you want to trade
Desktop plugin
Breakout
Signal
RiskRewardCalculator
The Risk-Reward plugin is a tool to visualize a trading idea based on other analysis tools,
Indicator
Grid
NAS100
NZDUSD
+16
AllPattern
🔍 Discover All Candlestick Patterns… Absolutely Free!
Indicator
Indices
RSI
Commodities
+1
OrderPrice-V3
A straightforward yet effective tool signals entry points for both buying and selling. Include 3 Moving Average
Indicator
Indices
Prop
Stocks
+5
New Way Sar - Free
The Parabolic SAR, or "Stop and Reverse," is a dynamic technical analysis tool
Indicator
Grid
Indices
Prop
+8
TSPivotSMC
Pivot Point MultiTimeFrame with Order Block
Indicator
RSI
Indices
Stocks
+3
FiboTrend-Pro
😎Read the description before purchasing💩
Indicator
Grid
NAS100
NZDUSD
+15
TS_Pivot
Those who are involved in trading know how important it is to take into account the previous session. With Order Block
Indicator
NAS100
RSI
NZDUSD
+18
HAIQuantum-V10
The HAI Quantum V10 is an advanced indicator designed for technical analysis
Indicator
Indices
Prop
Breakout
+7
NTNPICLL
NTNPICLL is a tool to check the best trading hours for the assets and also includes the highest and lowest point
Indicator
Indices
Prop
Stocks
+4
Pivot Point Smart Money Concept
Transform your approach to trading with our innovative Pivot Point Indicator.
Indicator
Indices
Prop
Stocks
+6
New Way Sar - Pro
The Parabolic SAR, or "Stop and Reverse," is a dynamic technical analysis tool
You may also like
VixFix
A volatility spike detector based on Larry Williams’ VIX Fix. Highlights market fear moments with clear histogram signal
Indicator
Indices
Breakout
Commodities
+2
LineHelper_Pro_DEMO
LineHelper PRO - Horizontal Lines + Trendlines in One Tool Visual trading guide
Indicator
NAS100
NZDUSD
Breakout
+14
Bollinger Bands Cloud
Visualize Bollinger Bands with a colored cloud for clarity. Enhance your trading precision with this dynamic indicator!
Indicator
Stocks
Forex
Crypto
PinBarCandlestickPattern
PinBarCandlestickPattern Indicator
Indicator
NAS100
NZDUSD
Breakout
+19
ICT Concepts from TradingView
Smart ICT Concepts indicator from TV: combining FVGs, Liquidity, Order Blocks, and Market Structure in one tool.
Zigzag T3
Three ZigZag lines
BWMFI_Visual
BW_MFI Vizual colors bars
E7 cTrader User ID
cTrader ID
Indicator
Breakout
Signal
AI
Verve Ai Range Scalper
ICT Channel – Precision buy/sell signals , customizable settings , User-Friendly Interface
Indicator
Indices
Prop
Stocks
+3
[Hamster-Coder] Price
Indicator designed to calculate and manipulate price inputs (sources) in real time
Indicator
Indices
Prop
Commodities
+4
TrendPulse
BrickAlgo TrendPulse is an advanced technical analysis tool that combines multiple indicators with filterin mechanisms.
Side Volume Profile
Right-anchored cTrader Volume Profile with VAH/VAL/POC, LVZ, top volume+EMA, themes, and fast, readable visuals.
Indicator
XAUUSD
HP 2910
buy and sell
Indicator
Indices
Prop
Stocks
+3
VegaXLR - Unlimited Trendline Alerts
This is an indicator that can alert you about trendlines, horizontal lines and vertical lines.
Indicator
Indices
RSI
Bollinger
Clustering
Clustering tool for traders with visual insights into market patterns.
Time To Break Even Indicator v2
Time To Break Even Indicator. This indicator helps you time your trade's entry.
Indicator
NAS100
NZDUSD
Martingale
+25
Volume Profile Suite trial7D
DEMO VERSION 7 DAYS VolumeProfileSuite is an advanced and flexible Volume Profile indicator for cTrader.
VWAP Tokyo Open
VWAP Set to Tokyo Open