HAIQuantum-V10
Indicator
3 purchases
Version 1.0, Aug 2025
Windows, Mac
5.0
Reviews: 1
"HAIQuantum-V10" uploaded image"HAIQuantum-V10" uploaded image"HAIQuantum-V10" uploaded image"HAIQuantum-V10" uploaded image
130
Sales
10.19K
Free installs

The HAI Quantum V10 is an advanced indicator designed for technical analysis of financial assets, particularly effective in volatile markets . Its architecture combines algorithmic intelligence with price behavior patterns, allowing traders to identify high-probability zones for entries and exits.

πŸ”₯ Back-to-Market Special – Limited Time Offer!

The holidays are over, and it's time to get back to business. As the markets wake up, so should your strategy.

To celebrate the return to action, I'm offering my most powerful trading tool β€” HAI Quantum V10 β€” for just $49.

This is a limited-time offer designed for serious traders who want to start the season strong. Whether you're refining your edge or looking for a reliable system, this is your chance to grab a proven indicator at a special price.

βœ… Built for Gold (XAUUSD) βœ… Tested across multiple timeframes βœ… Designed by a trader, for traders

Don't wait β€” this offer won't last. Get back in the game with confidence and precision.

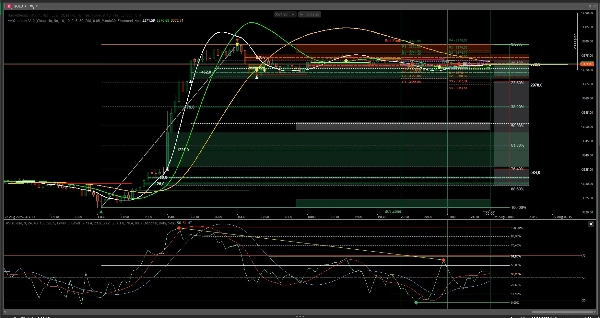
Our product integrates a set of key indicators to give you a comprehensive market perspective:

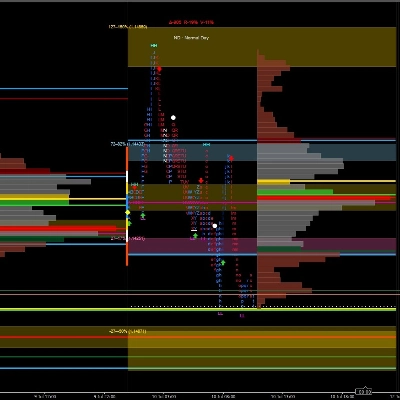
  • Range Box Fibonacci (our own creation): A unique tool that helps you identify potential support and resistance zones based on Fibonacci levels.
  • Key Reference Prices: We determine crucial price points from the confluence of three customizable indicators (CCI, Stochastic, RSI). These points will guide you in identifying entry and exit opportunities.
  • Three Configurable Moving Averages: Choose the moving averages that best suit your strategy to confirm trends and detect changes in price direction.
  • RSI: For more accurate price movement predictions. With high and low values ​​for selected periods. Not included in the visualization.

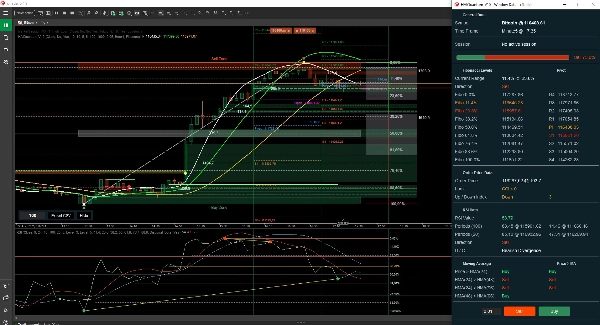
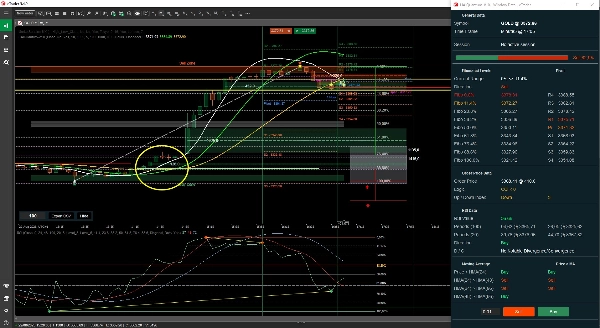
HAI Quantum collects and processes data from these indicators, offering you two visualization methods:

  • Manual Mode: A clear and concise window summarizing whether the price, according to each indicator configuration, is heading up or down.
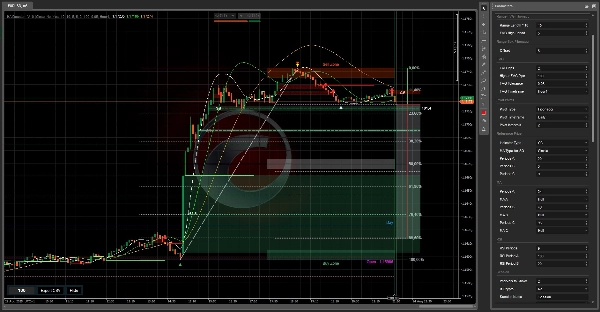
  • New data window with highlighted Fibonacci and Pivot levels: In this new version, we have integrated FVG (Fair Value Gap), which can be filtered by size and its proximity to a Fibonacci or Pivot level, along with their mitigation points, as shown in the image.
5.0
Reviews: 1
5
100 %
4
0 %
3
0 %
2
0 %
1
0 %
Customer reviews
August 28, 2025
Innovative algorithm, useful for trend/reversal detection. Indicator can be a valuable addition for advanced traders willing to test and fine-tune it. However, it should not be relied upon as a standalone signal provider, but rather as a complementary tool in a broader strategy.I loved it
NAS100
RSI
NZDUSD
Breakout
XAUUSD
Commodities
Martingale
Forex
Signal
EURUSD
MACD
GBPUSD
BTCUSD
AI
Indices
Prop
Stocks
Supertrend
Crypto
USDJPY
Scalping

More from this author

VWAP only timeframe
Indicator
NAS100
NZDUSD
XAUUSD
+10
😎Read the description before purchasingπŸ’©
Indicator
Indices
Prop
Stocks
+3
This indicator consists of 3 moving averages that can be configured to your liking, from the type of moving average....
Indicator
Grid
NAS100
NZDUSD
+15
This technical analysis indicator provides information on market sentiment, trend and price levels....
cBot
Commodities
MACD
This bot can automatically generate buy and sell orders based on three specific Fixed bugs.
Indicator
Stocks
Forex
MACD
😎Read the description before purchasingπŸ’©
Indicator
Grid
NAS100
NZDUSD
+16
πŸ” Discover All Candlestick Patterns… Absolutely Free!
Indicator
Grid
NAS100
NZDUSD
+15
With this Fibonacci retracement indicator, traders have full control over the retracement levels displayed on the chart.
Indicator
NAS100
NZDUSD
XAUUSD
+11
Session One is a tool for marking from to, useful if you've set the hours you want to trade
Indicator
Indices
RSI
Commodities
+1
A straightforward yet effective tool signals entry points for both buying and selling. Include 3 Moving Average
Indicator
Indices
Prop
Stocks
+5
The Parabolic SAR, or "Stop and Reverse," is a dynamic technical analysis tool.
Indicator
Indices
Prop
Stocks
+6
The Parabolic SAR, or "Stop and Reverse," is a dynamic technical analysis tool.

You may also like

Indicator
Indices
Prop
FVG
+6
SMC indicator for cTrader detecting order blocks, fair value gaps, liquidity sweeps and market structure with buy/sell
Indicator
NAS100
NZDUSD
Martingale
+26
Rolling Z-Score Trend Heat β€” See the Market's Temperature in Real Time
Indicator
Grid
NAS100
NZDUSD
+19
Session Volume Profile
Indicator
NAS100
RSI
NZDUSD
+13
πŸš€ HAI QUANTUM v4.0 | The Ultimate Quantum Terminal for cTrader (Smart Money & Algorithmic Trading)
Indicator
NAS100
NZDUSD
Breakout
+16
Undametrics: Professional trend-following indicator with precise step-levels and real-time reversal signals.
Indicator
NAS100
NZDUSD
Martingale
+26
KST Momentum Heatwave β€” Turn Momentum Into Market Temperature (On-Chart)
Indicator
NAS100
XAUUSD
Prop
+8
Advanced SMC/ICT Engine: MTF Structure, Liquidity Sweeps, Real-time Scoring & Pro Risk Dashboard. 100% Non-Repaint
Indicator
NAS100
NZDUSD
Indices
+9
Institutional-grade volatility suite with 4 estimators, VaR/CVaR, spike forecasting & dual-mode buy/sell signals
Indicator
NAS100
NZDUSD
Breakout
+16
Professional ZigZag Fibonacci tracer. Automated institutional level detection with dynamic market structure mapping.
Indicator
NAS100
NZDUSD
XAUUSD
+16
Advanced trend indicator using macro-period volatility analysis to identify key institutional price levels.
Indicator
NAS100
NZDUSD
XAUUSD
+12
Visual risk management terminal for cTrader. Set Lot size, SL, and TP via chart lines with real-time PnL projections.
Indicator
Indices
Commodities
Stocks
+3
Zone Pulse Rank
130
Sales
10.19K
Free installs