
WVAP-Bands Indicator_noSourceCode
Indicator
1 purchases
Version 1.0, Sep 2025
Windows, Mac
4.5
Reviews: 2
Description
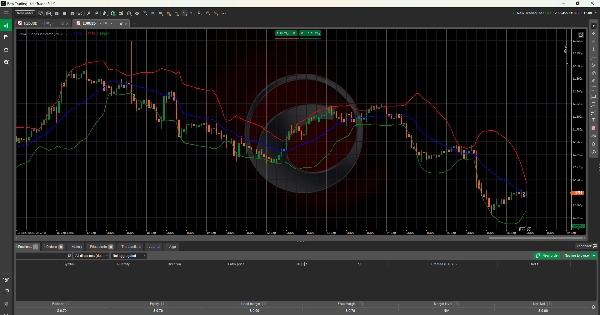
VWAP Bands - Professional Volume Analysis
Transform Your Trading with Institutional-Grade Precision
The VWAP Bands indicator delivers professional volume-weighted price analysis with dynamic standard deviation bands. Used by institutional traders worldwide for identifying optimal entry and exit points.
🚀 Key Features
- True VWAP Calculation: Volume-weighted average price using HLC/3 methodology
- Dynamic Bands: Upper/lower bands based on volume-weighted standard deviation
- Full Customization: Adjustable periods, colors, and band width multipliers
- Real-Time Analysis: Updates with every bar for immediate market insight
📊 Trading Applications
- Overbought/Oversold: Upper band = sell signals, Lower band = buy signals
- Dynamic Support/Resistance: VWAP acts as institutional reference level
- Mean Reversion: Trade reversals when price extends to band extremes
- Trend Confirmation: Strong breakouts through bands signal continuation
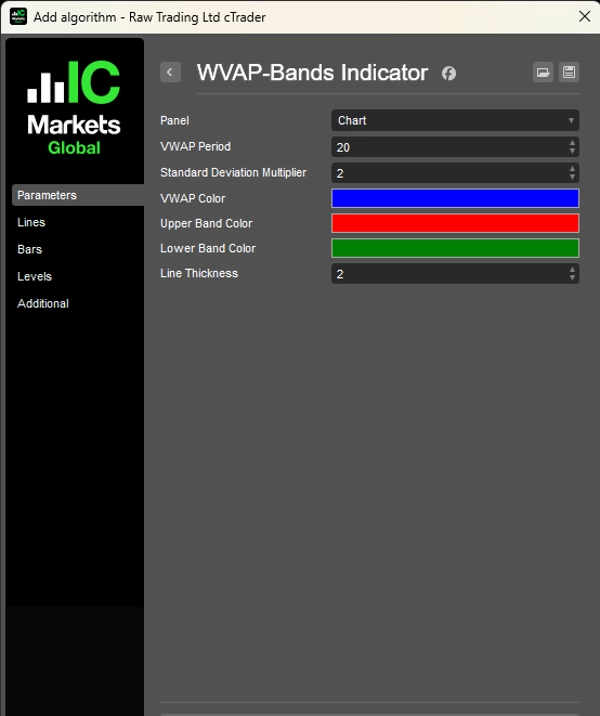
⚙️ Professional Settings
- VWAP Period: 1-200 bars (default: 20)
- Standard Deviation: 0.1-5.0 multiplier (default: 2.0)
- Visual Customization: Custom colors and line thickness
- Multi-Timeframe: Works on all timeframes and instruments
✅ Why VWAP Bands?
Superior to simple moving averages, VWAP Bands provide:
- Volume-weighted accuracy for true institutional analysis
- Adaptive volatility bands that adjust to market conditions
- Professional methodology used by successful traders globally
- Universal application across forex, stocks, crypto, and commodities
Perfect for scalpers, day traders, and swing traders seeking professional volume analysis.
Compatible with cTrader 4.0+. Works on all instruments and timeframes.
Summary
AI summary
The WVAP-Bands Indicator provides volume-weighted average price (VWAP) analysis enhanced with dynamic standard deviation bands. It calculates VWAP using the HLC/3 price method and overlays upper and lower bands based on volume-weighted standard deviation, offering adaptive volatility measures. The indicator supports full customization of periods, colors, and band width multipliers, allowing traders to tailor it to their strategies. It updates in real time with each new bar, delivering immediate market insights.
Key trading applications include identifying overbought and oversold conditions (upper band signals sell, lower band signals buy), dynamic support and resistance levels with VWAP as an institutional reference, mean reversion opportunities when prices reach band extremes, and trend confirmation through breakouts beyond the bands. Settings allow adjustment of VWAP period (1–200 bars), standard deviation multiplier (0.1–5.0), and visual elements such as colors and line thickness.
The indicator is compatible with all timeframes and instruments, including forex, stocks, cryptocurrencies, commodities, and indices. It is designed for scalpers, day traders, and swing traders seeking professional-grade volume analysis and is compatible with cTrader 4.0 and above.
Indicator profile
Customer reviews
4.5
Reviews: 2
5 | 50 % | |
4 | 50 % | |
3 | 0 % | |
2 | 0 % | |
1 | 0 % |
Customer reviews
October 4, 2025
The sample size matters. The useful metric is POC and VWAP first, compare the result with 20 reactions, and only scale if 2 sessions still looks controlled.
October 3, 2025
I liked it more as a extra filter for volume based context than as something to follow blindly. Pressure is easier to read, and the final decision still feels like it belongs to the trader. The next review on it on value area.
Discussion
FAQ
BTCUSD
Forex
Signal
Breakout
Indices
EURUSD
Commodities
GBPUSD
NZDUSD
Prop
Scalping
Crypto
Stocks
XAUUSD
NAS100
USDJPY
VWAP
Products available through cTrader Store, including trading bots, indicators and plugins, are provided by third-party developers and made available for informational and technical access purposes only. cTrader Store is not a broker and does not provide investment advice, personal recommendations or any guarantee of future performance.
More from this author


Price
Since 15/01/2025
7
Sales