HTF candles with Timeframe Alignment
Indicator
2 purchases
Version 2.0, Apr 2026
Windows, Mac
4.5
Reviews: 2
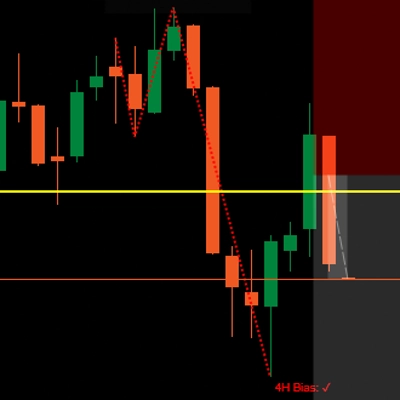
Trading product for HTF candles with Timeframe Alignment Indicator Forex Indices, image 2
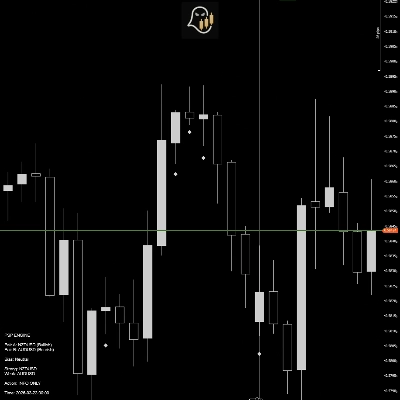
Trading product for HTF candles with Timeframe Alignment Indicator Forex Indices, image 3
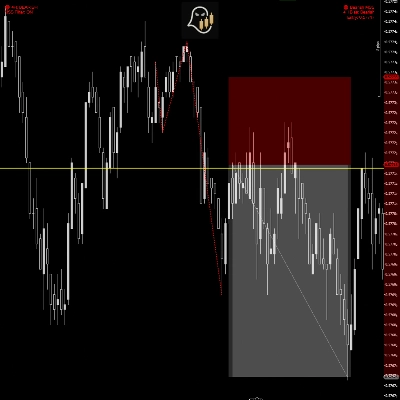
Trading product for HTF candles with Timeframe Alignment Indicator Forex Indices, image 4
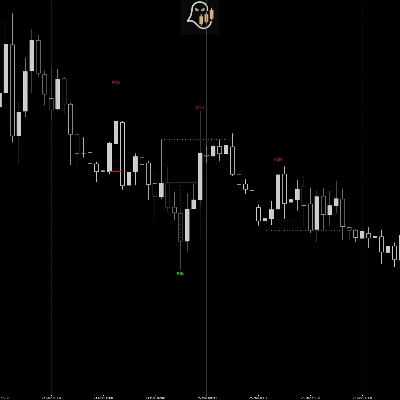
Trading product for HTF candles with Timeframe Alignment Indicator Forex Indices, image 5
Trading product for HTF candles with Timeframe Alignment Indicator Forex Indices, image 6
Trading product for HTF candles with Timeframe Alignment Indicator Forex Indices, image 7
2
Sales

Description

HTF Bias Detector β€” Panel Edition

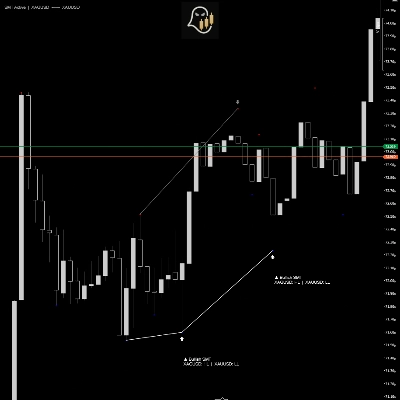
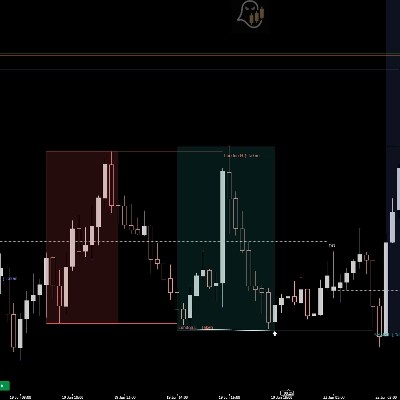
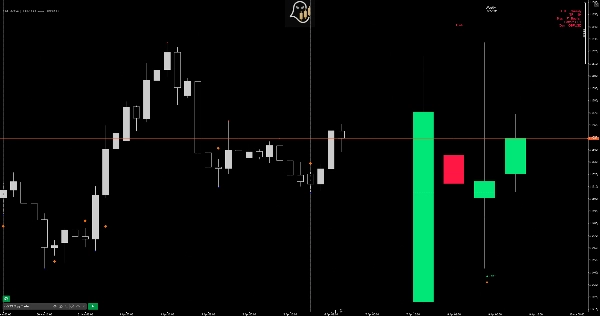
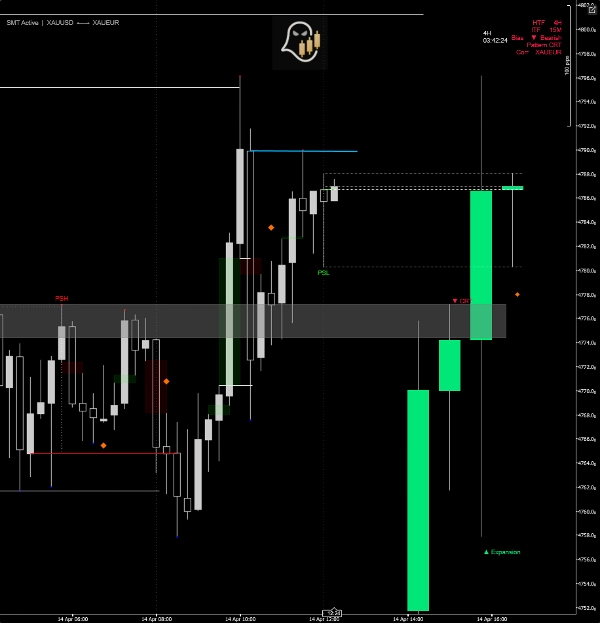
See the higher timeframe story at a glance. HTF Bias Detector renders the last N higher-timeframe candles in a floating panel directly on your chart β€” no need to switch timeframes β€” and automatically identifies the dominant bias using four institutional price action patterns.

How It Works

The indicator maps your current chart timeframe to its natural higher timeframe (e.g. 5M β†’ 1H, 1H β†’ Daily) and draws those HTF candles in a clean panel anchored to the right of price. Pattern detection then runs on those candles in real time.

Detected Patterns

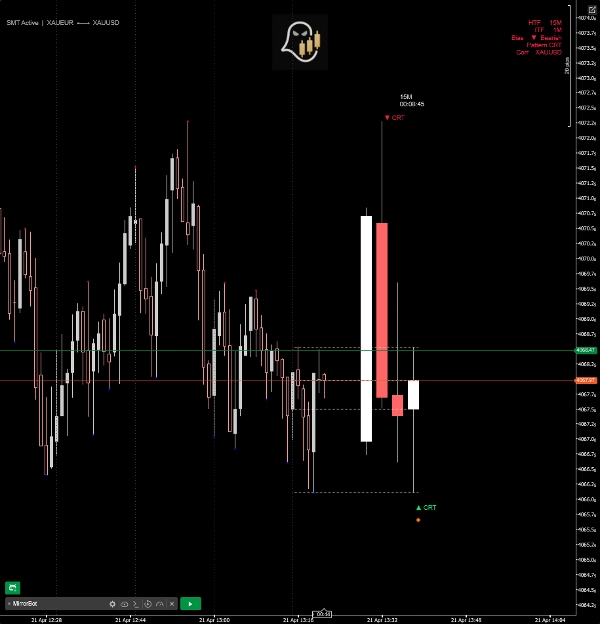
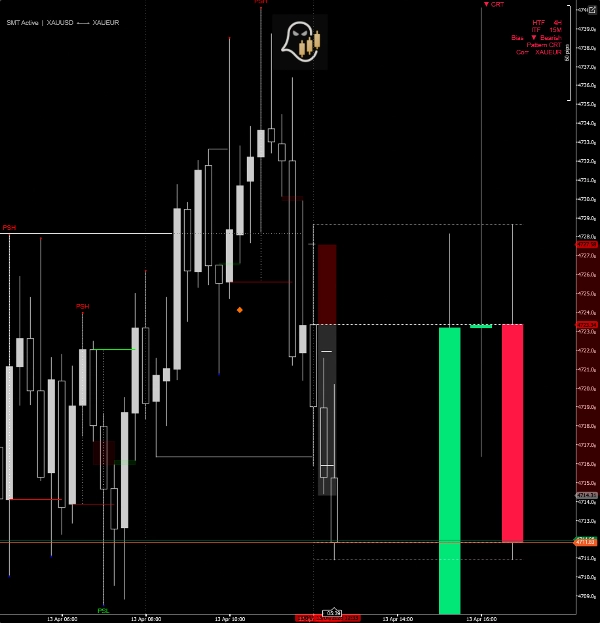
  • CRT (Candle Range Theory) β€” identifies trap candles that sweep a prior high or low and close back inside, signalling a likely reversal.
  • Expansion β€” flags candles that engulf the prior range entirely and close beyond it, confirming directional momentum.
  • Swing Point β€” detects three-candle sequences where a displacement candle is followed by a strong reversal, marking a structural turning point.
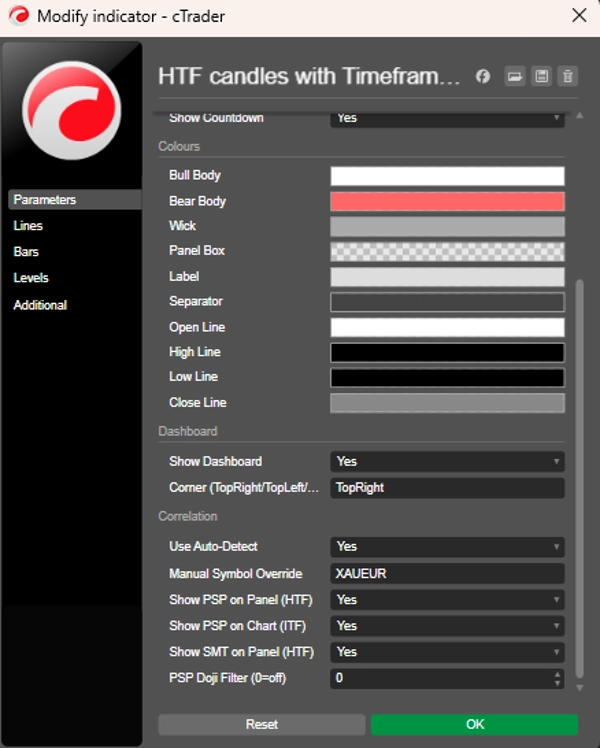
  • PSP (Precision Swing Point) β€” cross-pair divergence signal. When the primary symbol and its correlated pair print opposing directional candles at the same HTF bar, a PSP diamond is plotted.

SMT Divergence (HTF Panel)

Compares consecutive HTF candle pairs between correlated instruments. When one pair makes a lower low while the other makes a higher low (or vice versa on highs), an SMT divergence line is drawn directly on the panel with a directional label.

Correlated Pair Auto-Detection

Automatically resolves the correlated instrument for your chart symbol β€” covering major forex pairs, metals, indices, and crypto. A manual override is also available for custom pairings or broker-specific symbol names.

Additional Features

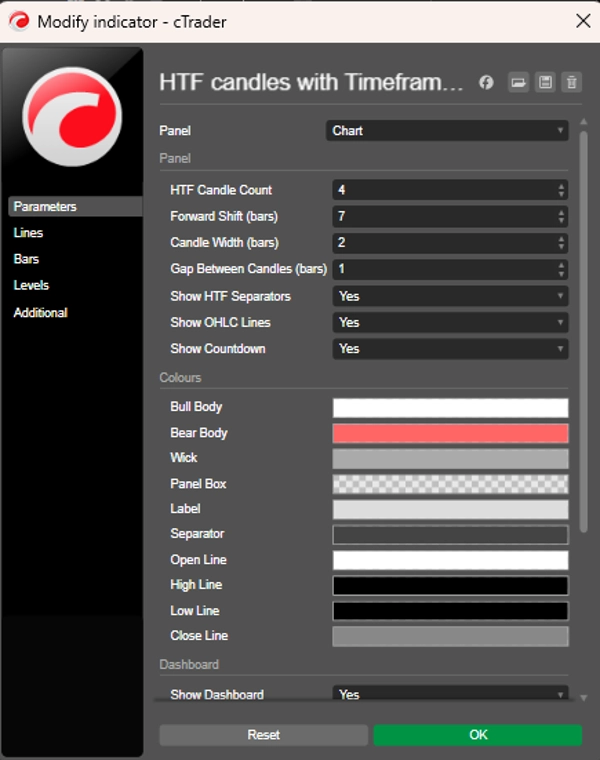
  • Live countdown timer to the next HTF candle close
  • OHLC dotted reference lines for the currently forming HTF candle
  • Vertical separators on the live chart aligned to HTF open times
  • Compact dashboard showing HTF, ITF, detected bias, pattern name, and correlated pair
  • ITF PSP diamonds plotted directly on chart bars (current timeframe)
  • Fully customisable colours, panel width, candle count, and positioning
  • Doji filter to suppress weak PSP signals

Timeframe Map

Chart TF HTF Panel

1M – 4M 15M

5M – 10M 1H

15M – 30M 4H

1H Daily

4H Weekly

Daily Monthly


Summary

AI summary
HTF Candles with Timeframe Alignment is a market structure indicator designed to display higher timeframe (HTF) candle data directly on your current chart via a floating panel. It automatically maps the chart’s timeframe to its natural higher timeframe (e.g., 5-minute to 1-hour, 1-hour to daily) and renders the last N HTF candles for quick visual reference without switching timeframes.
The indicator detects four institutional price action patterns in real time on these HTF candles: Candle Range Theory (CRT) trap candles signaling reversals, Expansion candles confirming momentum, Swing Point sequences marking structural turns, and Precision Swing Point (PSP) diamonds indicating cross-pair divergences. It also identifies SMT (Smart Money Technique) divergences between correlated instruments by comparing consecutive HTF candle pairs.
Correlated pairs are auto-detected for major forex pairs, metals, indices, and cryptocurrencies, with manual override options available. Additional features include a live countdown timer to the next HTF candle close, OHLC reference lines, vertical HTF open time separators, a compact dashboard showing HTF and intermediate timeframe bias and patterns, and customizable visual settings. The indicator supports multiple markets including forex, indices, and commodities.
Indicator profile
Indicator category
Market structure (SMC)
Output type
Visualisation
Signals
Data requirements
Tick data

Customer reviews

4.5
Reviews: 2
5
50 %
4
50 %
3
0 %
2
0 %
1
0 %
Customer reviews
April 3, 2026
April 2, 2026

Discussion

FAQ

Forex
Indices
Commodities
Products available through cTrader Store, including trading bots, indicators and plugins, are provided by third-party developers and made available for informational and technical access purposes only. cTrader Store is not a broker and does not provide investment advice, personal recommendations or any guarantee of future performance.

More from this author

Indicator
SMC
Forex
+3
Fractal MSS with 4H Bias is a smart market-structure indicator designed to detect: Market Structure Shifts (MSS)
Indicator
SMC
EURUSD
+4
PSP is a professional-grade trading tool built to detect candle-level SMT divergence between correlated markets
Indicator
SMC
Forex
+3
Fractal MSS with 4H Bias is a smart market-structure indicator designed to detect: Market Structure Shifts (MSS)
Indicator
SMC
Forex
+1
Protected Swings identifies critical swing points where institutional money has likely "protected" their positions.
Indicator
Forex
BTCUSD
+9
synchronize scroll position and zoom levels across multiple charts. Perfect for multi-timeframe analysis
Indicator
SMC
Forex
+10
Identify high-probability reversal zones by detecting SMT divergences between correlated pairs in real time

You may also like

Indicator
Prop
Forex
+14
πŸš€See the market’s framework, decide faster. Session-Aware Pivots. Auto Presets. Pro-Grade Zones.πŸš€
Indicator
Forex
NAS100
+3
volumen perfile
Indicator
BOS
CHOCH
+2
The full SMC suite: structure BOS CHoCH MSS , FVG, liquidity, order blocks & a 0 to100 confluence score. No repaint.
Indicator
VWAP
Forex
+12
Unlock VWAP in cTrader! Choose anchor periods, price sources, and display deviation bands with real-time tick updates.
Indicator
Allow trader to draw multi trendlines in different timeframes on one chart,Give trader an overview of the current market
Indicator
Forex
EURUSD
+7
Institutional Session Levels Pro OHLC,Prev(D,W,M OHLC)
Indicator
Forex
Indices
+1
Professional Fair Value Gaps with multitimeframe spot on
Indicator
ATR
CCI
+5
An institutional-grade trading system fusing triple hybrid moving averages, multi-oscillator momentum filters, Fair Valu
Indicator
Key Levels
Liquidity Grab
+3
Visual market context dashboard showing bias states, CE positioning, session status and sweep context.
Indicator
AI
RSI
+7
EMA MTF TREND PRO - Multi-timeframe trend analysis overlay indicator, 6 timeframes - in one table with ADX
Indicator
MSS
Key Levels
+4
Maps session ranges, previous highs/lows, equilibrium and premium/discount zones on your cTrader chart.
Indicator
ATR
RSI
+2
This indicator works best as a trend-confirmation toolβ€”wait for multiple signals!
Indicator
MSS
Market Structure
+2
Smart structural zones with pivot detection, ATR adaptation, sound alerts, and auto-color UI for precise entries.
Indicator
RSI
VegaXLR's cTrader StochRSI identifies overbought/oversold RSI levels for precise trade entries.
Indicator
Shows BUY & SELL signals for 3 & 4 BAR PATTERN (Morning star/ Evening star). It is adjustable and it will SHOW ARROWS.
Indicator
Prop
Forex
+5
Half Trend BT by BullittTraders
Indicator
ATR
VWAP
+4
Structure-aware indicator that re-anchors VWAP to confirmed swing pivots.
Indicator
VWAP
NAS100
+5
Key NY session opens for NASDAQ (US100) & SP500 to find Tick Precise Entrys for High R:R intraday setups.

Price

2
Sales