ICT KILLZONES
Indicator
Version 1.0, Jun 2026
Windows, Mac
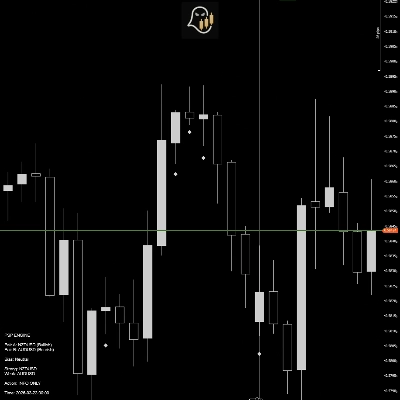
Trading product for ICT KILLZONES Indicator Key Levels Liquidity Sweep, image 2
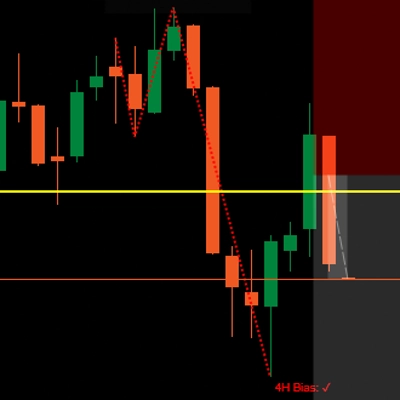
Trading product for ICT KILLZONES Indicator Key Levels Liquidity Sweep, image 3
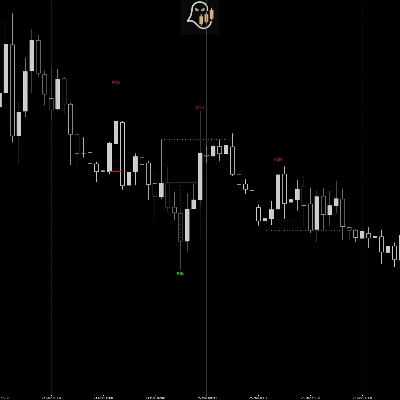
Trading product for ICT KILLZONES Indicator Key Levels Liquidity Sweep, image 4
Trading product for ICT KILLZONES Indicator Key Levels Liquidity Sweep, image 5
2
Sales

Description

ICT KILLZONES brings institutional session analysis directly to your cTrader charts. Built around ICT (Inner Circle Trader) methodology, it automatically maps the five key trading sessions — Asia, London, NY AM, NY Lunch, and NY PM — highlighting the precise time windows where smart money is most active and liquidity is most likely to be targeted.

What it does

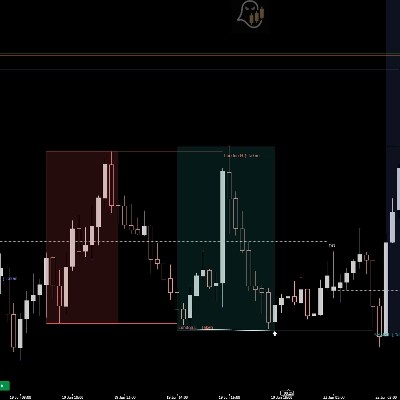
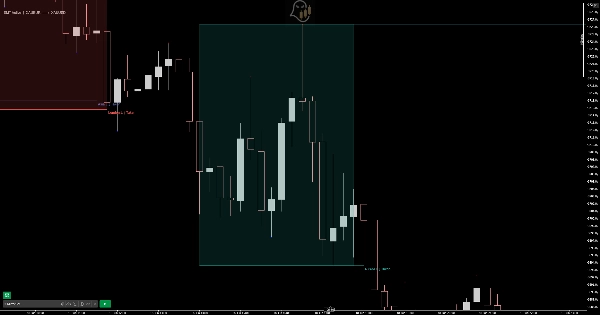
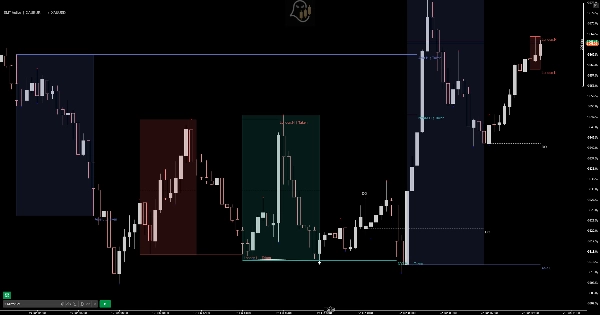
Each session is drawn as a shaded killzone box that expands in real time as price moves. The indicator tracks the session high and low as live pivot lines, extending them forward so you always know where key levels sit relative to current price. An optional midpoint line marks the equilibrium of each session range. A daily open line anchors every trading day, giving you an immediate reference for premium and discount.

Key features

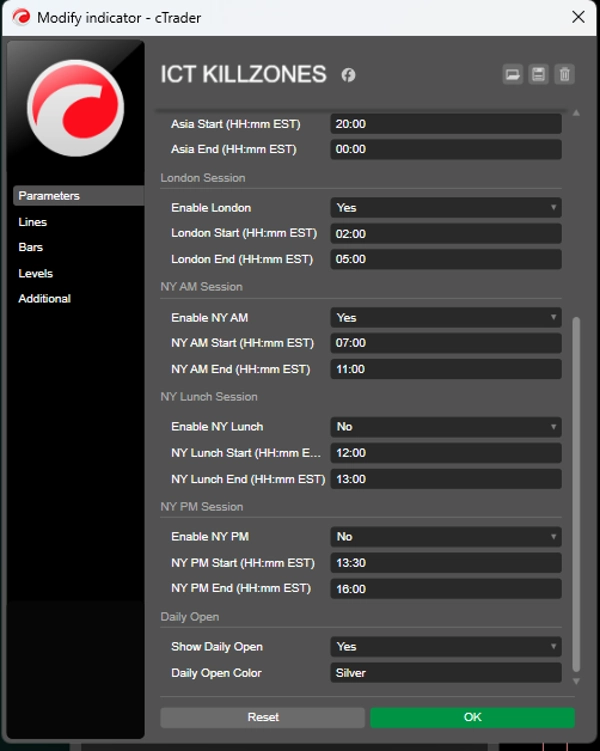
  • Five fully configurable sessions: Asia, London, NY AM, NY Lunch, NY PM — each independently toggled and colour-coded
  • Session high, low, and midpoint pivot lines with real-time extension
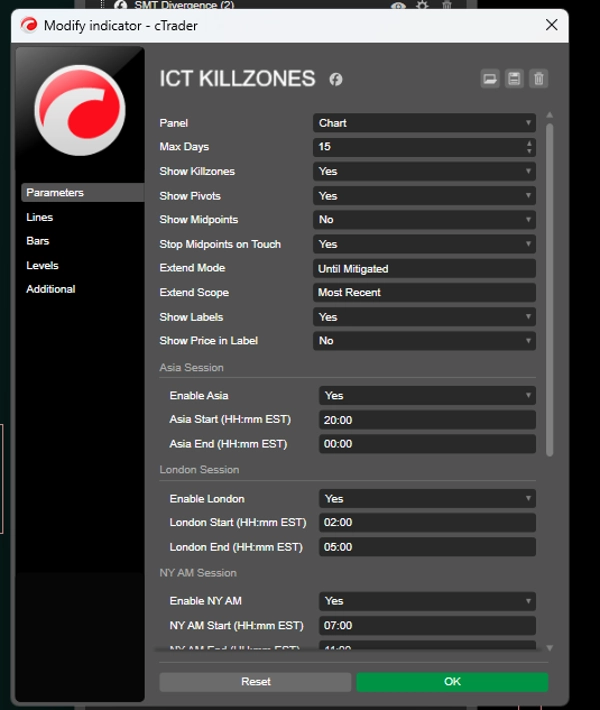
  • Three extension modes: Session Only, Until Mitigated, and Always
  • Mitigated levels are automatically marked as Taken or Touched so you never re-trade a swept level
  • Daily open line with optional price label
  • Most Recent or All Sessions scope control
  • Clean, minimal labels with optional price display
  • All session times entered in Eastern Time — daylight saving handled automatically
  • Works on M1 through M30 timeframes

Who it's for

Whether you trade ICT concepts, Smart Money, or simply want to understand where institutional order flow tends to concentrate, ICT KILLZONES gives you a structured, visual framework built around the sessions that matter most. Suitable for forex, indices, and commodities traders of all experience levels.

Summary

AI summary
ICT KILLZONES is a cTrader indicator designed to visualize key institutional trading sessions based on the Inner Circle Trader (ICT) methodology. It automatically maps five configurable sessions—Asia, London, NY AM, NY Lunch, and NY PM—highlighting specific time windows known as "killzones" where smart money activity and liquidity targeting are most prominent.
The indicator displays each session as a shaded box that expands in real time with price movement. It tracks session highs, lows, and optional midpoints as pivot lines, extending them forward to provide ongoing reference levels. A daily open line is also shown to indicate the day's price anchor. Users can customize session visibility, colors, and extension modes, including options for session-only or persistent pivot line extensions. Mitigated levels are marked to prevent re-trading of swept areas.
ICT KILLZONES supports timeframes from 1 to 30 minutes and automatically adjusts session times for Eastern Time with daylight saving. It is suitable for traders of forex, indices, and commodities who seek a structured visual framework to analyze institutional order flow and key price levels during major trading sessions.

Indicator profile
Indicator category
Market structure (SMC)
Output type
Visualisation
Data requirements
Bars only
Tick data
Supported signals
Breakout
Reversal

Customer reviews

0.0
Reviews: 0
Customer reviews
No reviews for this product yet. Already tried it? Be the first to tell others!

Discussion

FAQ

Key Levels
Liquidity Sweep
Products available through cTrader Store, including trading bots, indicators and plugins, are provided by third-party developers and made available for informational and technical access purposes only. cTrader Store is not a broker and does not provide investment advice, personal recommendations or any guarantee of future performance.

More from this author

Indicator
Forex
Indices
+1
Detects HTF bias using CRT, Expansion & Swing Point patterns with SMT/PSP divergence — visualised in a floating candle
Indicator
SMC
EURUSD
+4
PSP is a professional-grade trading tool built to detect candle-level SMT divergence between correlated markets
Indicator
SMC
Forex
+3
Fractal MSS with 4H Bias is a smart market-structure indicator designed to detect: Market Structure Shifts (MSS)
Indicator
SMC
Forex
+1
Protected Swings identifies critical swing points where institutional money has likely "protected" their positions.
Indicator
Forex
BTCUSD
+9
synchronize scroll position and zoom levels across multiple charts. Perfect for multi-timeframe analysis
Indicator
SMC
Forex
+10
Identify high-probability reversal zones by detecting SMT divergences between correlated pairs in real time
Indicator
SMC
Forex
+3
Fractal MSS with 4H Bias is a smart market-structure indicator designed to detect: Market Structure Shifts (MSS)

You may also like

Indicator
Indices
this indicator shows previous day high low and closed with precise manner.
Indicator
RSI
SMC
+3
High Low Divergence is a clean, overlay indicator that automatically identifies swing highs and swing lows
Indicator
VWAP
Volume
+5
Institutional Session VWAP, 3-Sigma Bands & Rejection Signals with Real-Time HUD Playbook. Engineered for Prop Firms
Indicator
ATR
Order Block
+5
Automated SMC analysis for cTrader. Real-time FVG & Order Block mapping, interactive playbook HUD & zero-lag engine.
Indicator
The Multi-Timeframe Candle Indicator displays candles from multiple timeframes in one window, enhancing market analysis!
Indicator
Volume
Imbalance
+5
Spot Institutional Order Flow with Proportional Volume Bubbles & Integrated Cumulative Volume Delta (CVD) Intelligence.
Indicator
ATR
BOS
+5
Full ICT/SMC 4-step setup checker that alerts a long or short setup.
Indicator
Displays the previous day's, last week's, and last month's highest and lowest price levels on your chart.
Indicator
Forex
Crypto
+4
Auto Trend Line Indicator for cTrader
Indicator
EMA
VWAP
+2
ORB Range Indicator maps the opening range and gives a practical session-breakout workflow with clear labels.
Indicator
VWAP
Volume
+5
The MA Quant Volume Profile Custom Range is a trading indicator that analyzes volume distribution across the price.
Indicator
ATR
Channel
+1
Bollinger Bands Advanced Squeeze & Breakout System, Real-Time On-Chart Dashboard, Auto-Squeeze Detector, Dual-Band Cloud
Indicator
Key Levels
Order Block
+2
It monitors trend lines on price charts and fires multi-channel alerts and optionally places trades when price crosses..
Indicator
AI
SMC
+13
Dynamic Liquidity Depth exposes hidden volume
Indicator
RSI
Key Levels
+3
MARCs Multi-timeframe market dashboard with trend rows, RSI context, sessions, presets and optional chart levels.
Indicator
The Advanced Volume Profile Indicator calculates POC, Median, and Mode, revealing key price levels for smarter trading.
Indicator
ATR
Upgrade to ATR-RMA! Experience the precise ATR using Relative Moving Average for accurate volatility analysis in cTrader
Indicator
ATR
Forex
+5
Most used candle patterns. (1 candle, 2 candles and 3 candles patterns) and Marubozu. Bonus Fibo Risk control.

Price

2
Sales