MACD Indicator
Indicator
Version 1.0, Jun 2026
Windows, Mac
Trading product for MACD Indicator Indicator EMA SMA, image 2
Trading product for MACD Indicator Indicator EMA SMA, image 3
Trading product for MACD Indicator Indicator EMA SMA, image 4
Trading product for MACD Indicator Indicator EMA SMA, image 5
Trading product for MACD Indicator Indicator EMA SMA, image 6
85
Sales
137
Free installs

Description

Showcase:


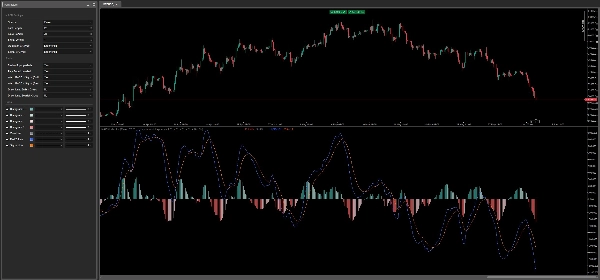
MACD Indicator is a refined and visually enhanced version of the classic Moving Average Convergence Divergence (MACD) oscillator for the cTrader platform. Built to mirror the behavior and appearance of the TradingView original, it delivers a familiar, professional-grade experience with several smart upgrades.


Why Choose the MACD Indicator?

1. 100% TradingView Compatibility

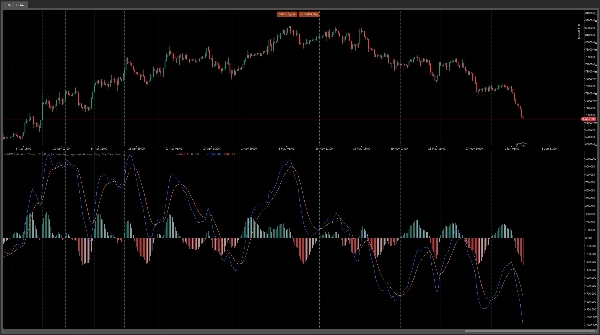
The core algorithm follows the exact same logic as the standard MACD on TradingView. It calculates the MACD line as the difference between a Fast and Slow moving average, derives a Signal line from a third moving average, and plots the histogram as the difference between the two. The result is pixel-perfect alignment with the charts you already know.

2. Intelligent 4-Color Histogram

Instead of a simple two-tone histogram, this indicator uses a dynamic four-color gradient system identical to TradingView's PineScript implementation:

- Strong Positive – histogram bar is above zero *and* rising

- Weak Positive – histogram bar is above zero *but* falling

- Weak Negative – histogram bar is below zero *but* rising

- Strong Negative – histogram bar is below zero *and* falling

This color intelligence lets you instantly assess whether momentum is accelerating or weakening, without needing to interpret raw numbers.

3. Built-in Alert System with Pop-up & Sound*

Stay informed even when you're away from the screen. The indicator can send you native cTrader pop-up notifications and play distinct sounds when:

- The MACD line crosses above the Signal line (Bullish Cross – buy signal)

- The MACD line crosses below the Signal line (Bearish Cross – sell signal)

Each alert type can be toggled independently, and the system is protected against duplicate alerts on the same bar.

4. Customizable Visual Signals

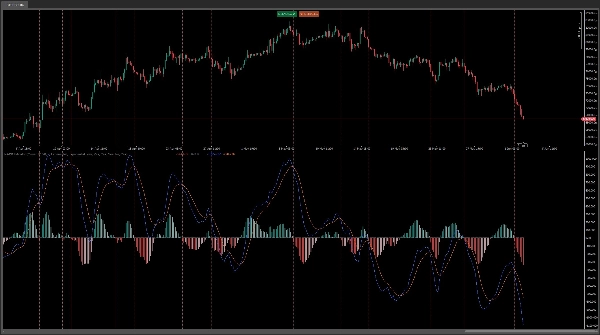
You can optionally draw dotted vertical lines on the chart every time a bullish or bearish cross occurs. This makes it easy to scan historical charts and identify past signal zones at a glance, without manually scrolling through data.

5. Fully Customizable & Flexible

Fine-tune every aspect of the indicator to match your trading style:

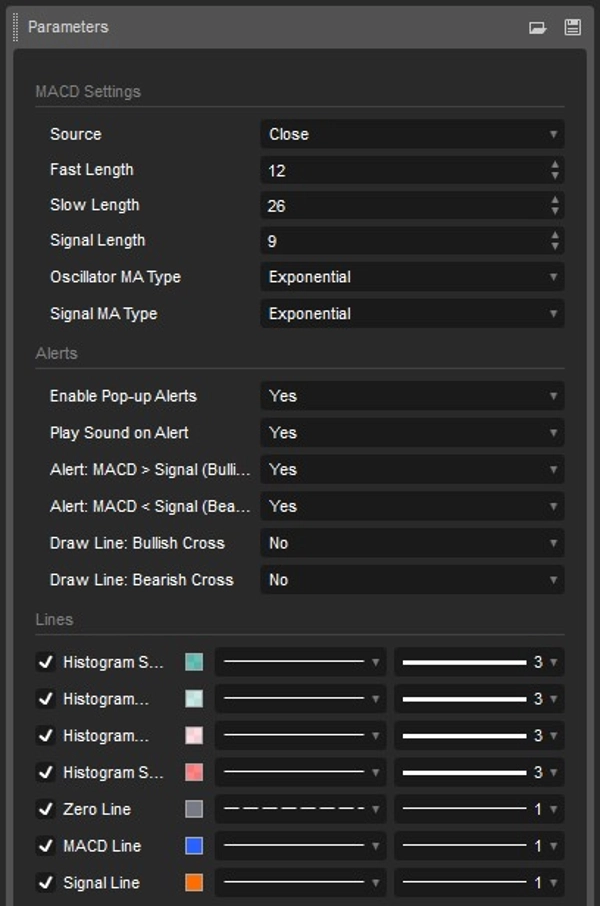
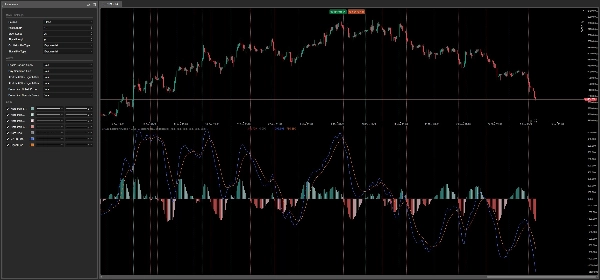
- Fast Length – period for the fast moving average

- Slow Length – period for the slow moving average

- Signal Length – period for the signal line moving average

- Oscillator MA Type – choose from any moving average type (EMA, SMA, etc.) for the MACD calculation

- Signal MA Type – independently select the MA type for the signal line


Who Is This Indicator For?

TradingView Power Users who want a cTrader-native MACD that behaves, calculates, and colors exactly like the original – no surprises, no mismatches.

Discretionary Traders looking for clear, real-time crossover alerts with both pop-up notifications and sound, making it easy to catch entries without staring at the screen all day.

Analytical Traders who appreciate the four-color histogram as a momentum diagnostic tool – quickly identify whether bullish or bearish pressure is gaining or losing strength.

All Experience Levels – the MACD is a foundational oscillator, and this implementation makes it more accessible than ever with its clean visuals, smart color coding, and fully configurable alert system.


cGuru

Summary

AI summary
The MACD Indicator for cTrader is a precise implementation of the classic Moving Average Convergence Divergence oscillator, designed to replicate TradingView’s original behavior and appearance. It calculates the MACD line as the difference between fast and slow moving averages, derives a signal line from a third moving average, and displays a histogram representing their difference. The histogram uses a four-color gradient to indicate momentum strength and direction: strong positive, weak positive, weak negative, and strong negative, enabling quick visual assessment of momentum changes.
This indicator includes a built-in alert system with customizable pop-up and sound notifications for bullish and bearish MACD-signal line crossovers, with options to toggle alerts independently and prevent duplicates. Users can also enable vertical dotted lines on the chart to mark crossover events for easier historical analysis.
All parameters are fully customizable, including the periods for fast, slow, and signal moving averages, as well as the types of moving averages used (EMA, SMA, etc.). The indicator supports signals for crossovers and trend strength, and requires bar or tick data input. It is suitable for traders seeking a TradingView-compatible MACD with enhanced visual cues and real-time alerts on the cTrader platform.

Indicator profile
Indicator category
Trend
Output type
Signals
Filter
Visualisation
Data requirements
Bars only
Tick data
Supported signals
Cross
Trend strength

Customer reviews

0.0
Reviews: 0
Customer reviews
No reviews for this product yet. Already tried it? Be the first to tell others!

Discussion

FAQ

EMA
SMA
Key Levels
MACD
Moving Average
Products available through cTrader Store, including trading bots, indicators and plugins, are provided by third-party developers and made available for informational and technical access purposes only. cTrader Store is not a broker and does not provide investment advice, personal recommendations or any guarantee of future performance.

More from this author

Indicator
AI
ATR
+27
Trend Is Your Friend cBot - INDICATOR - Professional Grid, Pyramid, Swing & Scalp Trading Indicator
Indicator
AI
ATR
+27
Supertrend Indicator
Indicator
AI
ATR
+27
Nadaraya-Watson Envelope Indicator
Indicator
AI
ATR
+27
Market Cipher B
Indicator
AI
ATR
+27
Supertrend Indicator
Indicator
AI
ATR
+26
MacD Custom Indicator-Multiple Time Frame
Indicator
AI
ATR
+19
Market Cipher A
cBot
AI
ATR
+27
RSI Simple Grid cBot - grid trading strategy with RSI (Relative Strength Index) signals
26.8%
ROI
4.41
Profit factor
cBot
AI
ATR
+27
SmartHedge cBot - Your Trading Companion
1.26
Profit factor
cBot
ATR
RSI
+5
Trend is your friend cBot - Professional Grid, Pyramid, Swing & Scalp Trading System
28%
ROI
5.27
Profit factor
Indicator
RSI
SMA
+1
TradingView RSI replica for cTrader with dynamic gradients, automatic divergence detection, and alerts.

You may also like

Indicator
RSI
Prop
+14
Unlock Stochastic RSI PRO in cTrader! Overlay RSI, highlight zones, and identify divergences with customizable settings.
Indicator
VWAP
Forex
+2
Custom VWAP Indicator for cTrader
Indicator
Prop
Forex
+4
Draws pivots (P, S/R, CPR) from selected anchors like H1–Month1, with optional mid-levels (PS1, S1S2, etc.)
Indicator
Forex
Indices
+1
Professional Fair Value Gaps with multitimeframe spot on
Indicator
ATR
Channel
+1
Bollinger Bands Advanced Squeeze & Breakout System, Real-Time On-Chart Dashboard, Auto-Squeeze Detector, Dual-Band Cloud
Indicator
Signal
USDJPY
See USD demand in one lineβ€”Composite OBV fuses six major FX pairs into a clear momentum gauge.
Indicator
Forex
Alerts you when price touches Fibonacci levels. Stay organized and trade efficiently!
Indicator
MACD
Key Levels
+2
Trend indicator with multi-timeframe filters, generating signals only on fully completed bricks & candles. No Repaint.
Indicator
The Weekly Daily Levels indicator shows the OHLC, and mid-point prices for the previous day and week.
Indicator
BOS
MSS
+3
Maps BOS, CHoCH, swing breaks and market structure shifts directly on your cTrader chart.
Indicator
Order Block
Fair Value Gap
+3
This indicator scans multi-timeframe trend confluence and price action triggers within key supply/demand zones
Indicator
Forex
Detects valid Fair Value Gaps from strong 3-bar patterns. Keep drawing unfilled gaps until price fills them.
Indicator
ADX
ATR
+2
Quantum Breakout Pro Professional Breakout Indicator for cTrader
Indicator
Market Sessions
Indicator
Forex
BTCUSD
+4
This indicator is designed to perform multiple non-linear regression analysis using four independent variables.
Indicator
AI
ATR
+27
Trade the Trend Flip. Control the Risk. πŸŽ―πŸ“ˆβ€
Indicator
Supply & Demand
Support & Resistance
RAF Supply Demand Lite v1.0 automatically detects clean Supply and Demand zones using confirmed swing highs and lows. Zo
Indicator
Key Levels
Market Structure
+1
HTF Candle Projector displays the current Higher Timeframe candle (4H or 1H) as a real projected candle LIVE..

Price

85
Sales
137
Free installs