
Description
MACD Custom MTF (Multiple Time Frame) v1.1 is an advanced tool that fuses the proven power of the classic MACD with the critical edge of multi-timeframe analysis and modern, intuitive visualization. Designed for discerning traders who demand precision, rapid interpretation, and the ability to tailor tools to their unique strategy.
What's New in Version 1.1:
- 100% Smooth Visuals: Fixed broken/discontinuous MACD lines – the lines are now perfectly continuous during trend changes.
- Better Visibility: Increased the size of Buy/Sell signal dots, thickened the Signal Line and Histogram for a crystal-clear view. Dimmed the Zero Line to reduce eye strain.
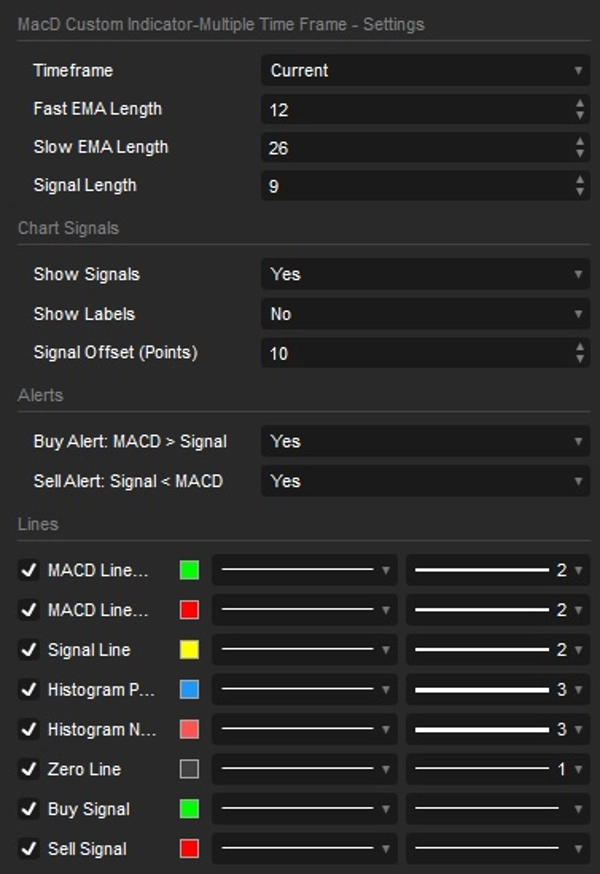
- Smart & Simplified Alerts: Cleaned up the settings window. Just toggle "Buy Alert" or "Sell Alert" and the indicator automatically handles the on-screen Popups and correct sound notifications.
- Organized Settings: All parameters are now beautifully grouped into intuitive categories for a much better user experience.
- Full English Localization: All log messages, popups, and errors have been fully localized to English.
Multi-Timeframe (MTF) Analysis on a Single Chart:
Stop the chart-juggling! Display MACD data from a higher timeframe (e.g., H1, H4, D1) directly onto your current working chart (e.g., M5, M15). Gain invaluable broader market context, identify dominant underlying trends, and effectively filter out misleading noise from lower timeframes. Fully configurable – choose from a comprehensive list of timeframes, from minutes to monthly.
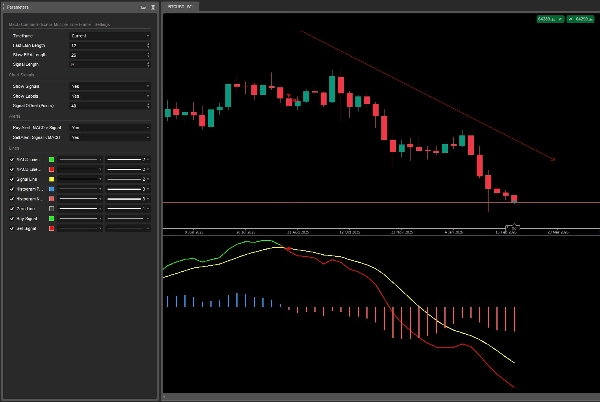
Dynamic MACD & Signal Line Coloring:
Instant trend confirmation: The MACD line dynamically changes color upon crossing its signal line, vividly illustrating bullish or bearish momentum. No more guesswork – the line color immediately tells you if the MACD is above (bullish) or below (bearish) its signal.
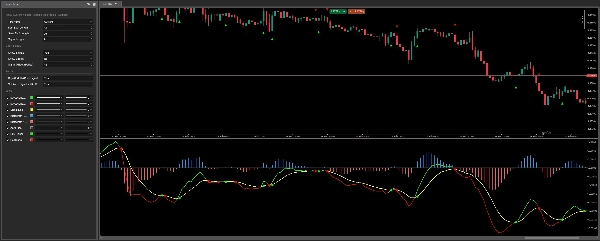
Crystal-Clear Histogram:
Easily visualize the divergence (strength) between the MACD and its signal line. The indicator intuitively colors thickened bars based on whether they are positive (blue) or negative (red), providing deep insight into momentum shifts at a single glance.
Unmistakable Visual Crossover Signals:
Never miss a critical crossover again! The indicator automatically highlights MACD/Signal line crosses. It plots distinct, highly visible dots directly on your price chart (with an adjustable offset) and offers optional "Buy"/"Sell" text labels for ultimate clarity.
Integrated Smart Alerts:
Features built-in, hassle-free Popup and Sound notifications for Buy and Sell signals. Stay informed of every opportunity without being glued to your screen! Just toggle the alerts in the settings and let the indicator do the watching for you.
Full Customization at Your Fingertips:
- Tailor Fast EMA, Slow EMA, and Signal Line lengths to your precise specifications.
- All settings are neatly organized into logical groups (MACD Settings, Chart Signals, Alerts) for quick adjustments.
- Toggle visibility for individual visual elements: MACD & Signal lines, Histogram, Crossover Signals, and Labels.
- Adjustable signal offset to perfectly match your chart aesthetics and preferences.
Summary
Key features include dynamic coloring of the MACD and signal lines to indicate bullish or bearish momentum, a crystal-clear histogram that visualizes the divergence between MACD and its signal line with color-coded bars, and unmistakable visual crossover signals marked by distinct dots or arrows on the price chart. The indicator supports integrated alerts with popup and sound notifications for buy and sell signals, configurable via a streamlined settings interface.
Users can fully customize the indicator by adjusting Fast EMA, Slow EMA, and Signal Line lengths, toggling visibility of visual elements (lines, histogram, signals, labels), and modifying colors and line thickness. The settings are organized into intuitive categories for ease of use. This indicator supports a wide range of timeframes from minutes to monthly and is suitable for various markets including Forex, indices, commodities, stocks, and cryptocurrencies.
Customer reviews
5 | 100 % | |
4 | 0 % | |
3 | 0 % | |
2 | 0 % | |
1 | 0 % |


!["[CB] Pivot Points Pro" logo](https://cdn.ctrader.com/image/webp/43463c82-67b0-4f10-a4ba-901bba091d81_32594)


