Description
The Volume Profile Pro is a highly customizable and lightweight Volume Profile indicator for cTrader where you can adjust a lot of settings to your preference including the Point Of Control (POC), Value Area High (VAH) and Value AreaLow (VAL)
What It Does
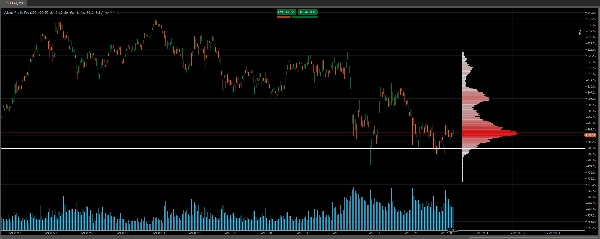
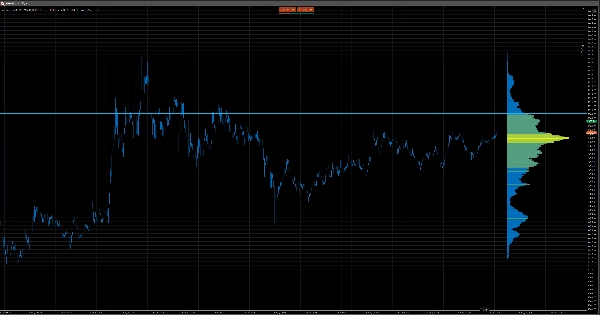
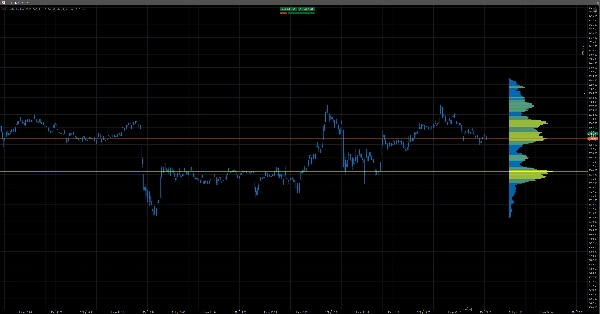
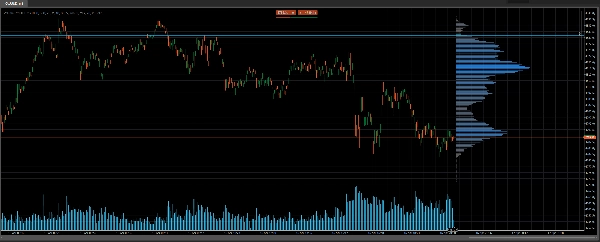
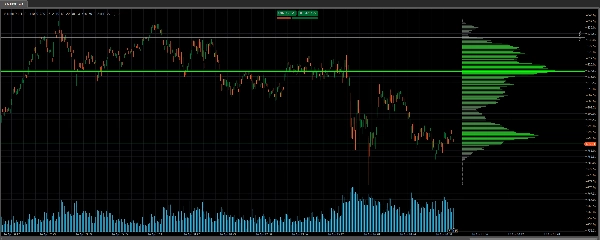
Volume Profile Pro plots a horizontal histogram directly on your cTrader chart showing how much volume traded at each price level over a configurable lookback window. Rather than measuring volume over time, it measures volume by price — instantly revealing where the market has transacted the most business. From this, it automatically calculates and draws three key levels: the Point of Control (POC), the price with the highest traded volume; and the Value Area High (VAH) and Value Area Low (VAL), the boundaries of the price range containing 70% of all traded volume (configurable).
How It Works
The indicator scans a user-defined number of historical bars, finds the high-to-low price range, and divides it into evenly spaced price rows. Each bar's tick volume is then distributed across every price row it spans. The result is a volume-at-price histogram with customizable bar widths proportional to volume and a gradient color scheme shifting from low- to high-volume rows. It runs entirely on standard bar-level OHLCV data — no tick feed, no DOM, no external data source required — and only recalculates on the last bar, keeping it fast, lightweight and non-disruptive.
Highly Customizable
Nearly every visual and analytical element is adjustable: lookback period, number of price rows, profile width, row thickness, opacity, gradient color scheme, POC color and thickness, Value Area percentage threshold, and VA line style. This makes it equally usable as a subtle background reference layer or a bold standalone analytical tool.
Who this is for
- Traders who want a Volume Profile indicator that is lightweight
- Traders who want a clean looking Volume Profile
- Traders who want to set the lookback period on the chart themself
- Traders who want to have the ability to set many colors and opacity
- Traders who want to adjust the width and placement on the chart
- Traders who want to set the number of price rows (recommended to keep this below 400)
- Traders who want to turn the Point Of Control (POC), Value Area High (VAH) and Value Area Low (VAL) lines on or off and adjust the appearance
Combine this with our Level 2 DOM Volume Delta Pro indicator for even better informed decisions at key levels: https://ctrader.com/products/4138
See our amazing Black Box Bot here: https://ctrader.com/products/3241
Summary
The tool analyzes historical bar data by dividing the high-to-low price range into evenly spaced rows and distributing each bar’s tick volume across these rows. This creates a volume-at-price histogram with adjustable bar widths proportional to volume and a gradient color scheme indicating volume intensity. It operates solely on standard OHLCV bar data without requiring tick feeds or external sources, recalculating only on the latest bar to maintain performance.
Users can extensively customize visual and analytical settings, including lookback period, number of price rows, profile width, opacity, colors, and the appearance and visibility of POC, VAH, and VAL lines. This flexibility allows the indicator to serve as either a subtle background reference or a prominent analytical tool. It supports analysis of key market structure concepts such as supply and demand, support and resistance, and liquidity zones.
Customer reviews
5 | 0 % | |
4 | 100 % | |
3 | 0 % | |
2 | 0 % | |
1 | 0 % |