
Frac Support Resistance V1
Indicator
2 purchases
Version 1.0, Nov 2025
Windows, Mac
5.0
Reviews: 1
Description
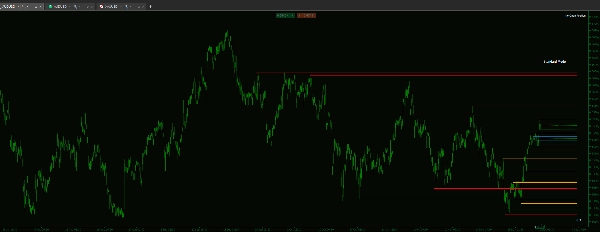
If you trade based on market structure, you know the most critical levels are often set on a higher timeframe. This custom indicator solves the frustration of manually identifying and tracking those levels.
This tool is designed to provide a reliable visual hierarchy, ensuring you can see critical structural boundaries and prioritize high-value zones without leaving your execution screen.
Key Features & Granular Control
- The indicator is built for exceptional performance and clean chart visualization:
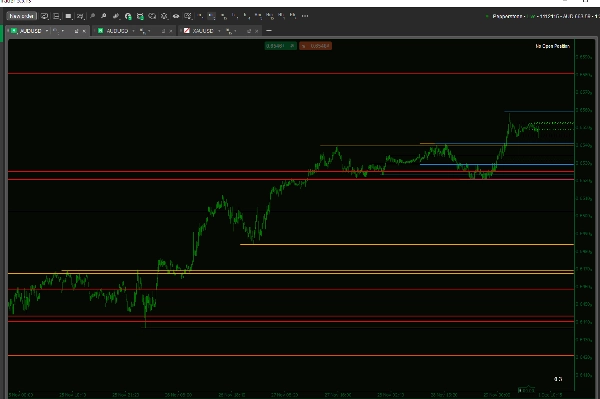
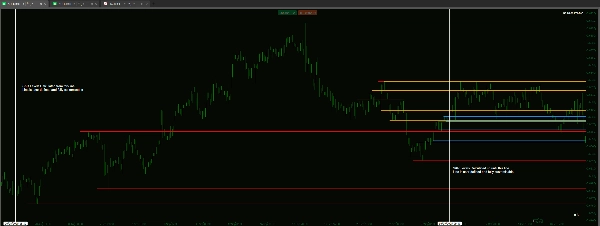
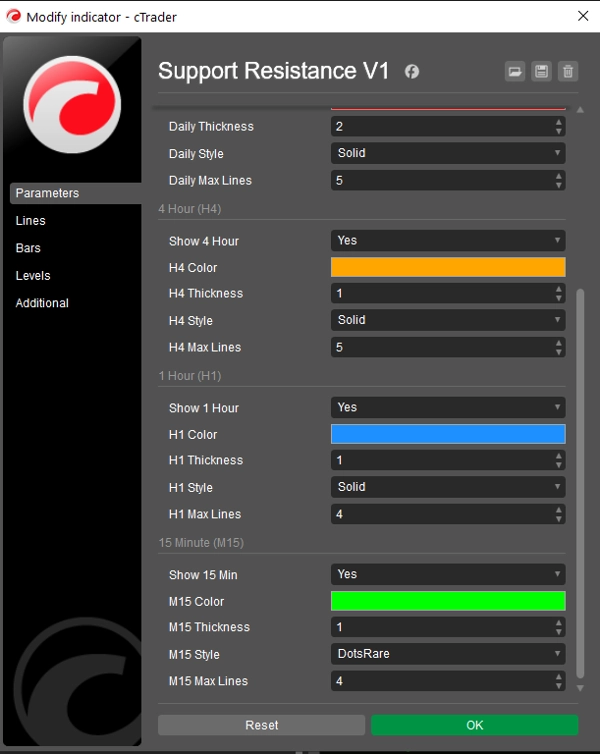
- True Visual Hierarchy: Gain independent control over the thickness, line style (Solid, Dash, Dot), and color for every single timeframe.
- Benefit: Immediately recognize the strength of a level just by its appearance (e.g., set D1 lines to be Thick/Solid for major structure and H1 lines to be Thin/Dotted for immediate levels).
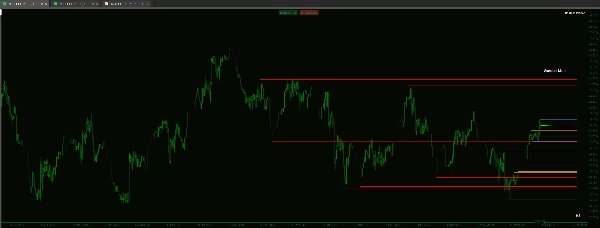
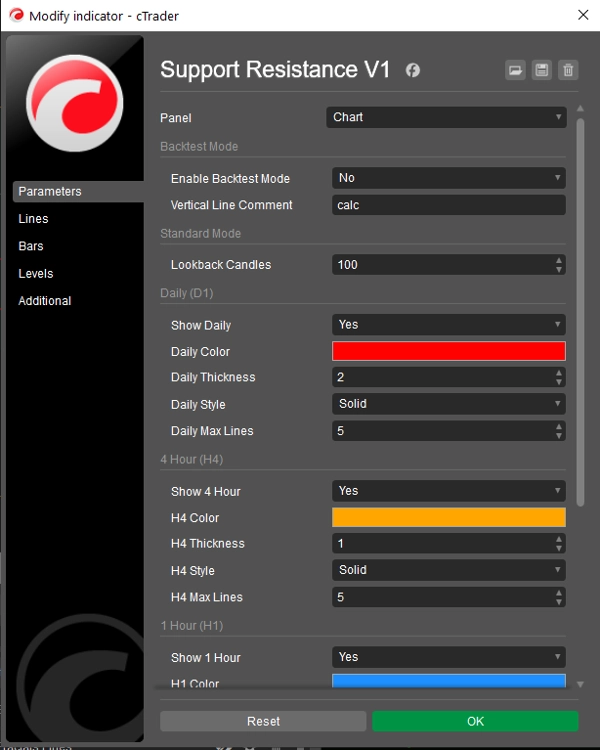
- Performance & Focus Control: Tired of cluttered charts? You can limit the Max Number of Lines displayed for each timeframe individually.
- Example: Set H4 Max Lines to 5 and D1 Max Lines to 15 to prioritize recent levels on lower timeframes while maintaining a deeper view of major structures.
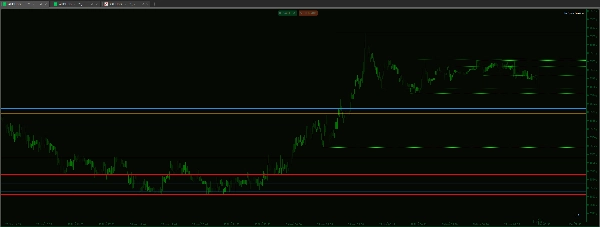
- Clean Code Foundation: Built on reliable fractal logic, ensuring the identified levels are genuine high/low pivots used in standard structure analysis.
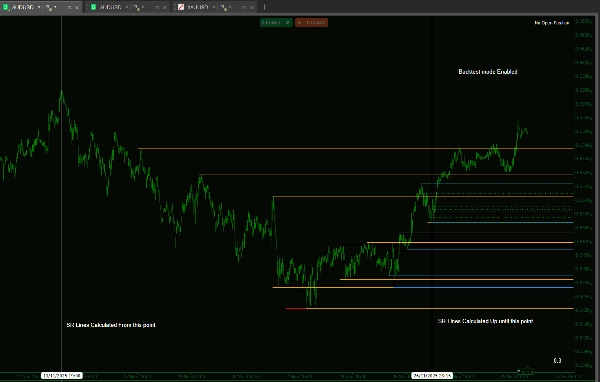
- Dedicated Backtesting Mode: Includes a function to constrain the indicator's analysis to a specific, defined time range on the chart. This is essential for accurate manual backtesting by simulating time progression without future bias.
Summary
AI summary
Frac Support Resistance V1 is a technical indicator designed to automatically calculate and display smart support and resistance lines derived from multiple timeframes: daily (D1), 4-hour (H4), hourly (H1), and 15-minute (M15). It assists traders who rely on market structure by visually highlighting critical price levels established on higher timeframes, reducing the need for manual identification.
Key features include customizable visual hierarchy, allowing independent adjustment of line thickness, style (solid, dashed, dotted), and color for each timeframe. This enables quick recognition of the relative strength of support and resistance levels. Users can also control chart clarity by setting maximum numbers of lines per timeframe to prioritize recent or major structural levels.
The indicator is based on fractal logic to identify genuine high and low pivots consistent with standard market structure analysis. It includes a dedicated backtesting mode that restricts analysis to a specified historical period, facilitating unbiased manual strategy testing by simulating real-time progression.
Frac Support Resistance V1 supports various markets including Forex, cryptocurrencies, commodities, indices, and stocks, with tags indicating compatibility with symbols like BTCUSD, EURUSD, GBPUSD, XAUUSD, NAS100, and USDJPY. The tool is suited for strategies involving breakout, scalping, smart money concepts, and grid trading.
Indicator profile
Customer reviews
5.0
Reviews: 1
5 | 100 % | |
4 | 0 % | |
3 | 0 % | |
2 | 0 % | |
1 | 0 % |
Customer reviews
December 1, 2025
A small account test feels safer, and the plan becomes easier to stick with, and the chart still needs a final look.
Discussion
FAQ
BTCUSD
Forex
Signal
Breakout
Indices
EURUSD
Commodities
GBPUSD
NZDUSD
Prop
Scalping
SMC
Crypto
Grid
Stocks
AI
XAUUSD
NAS100
USDJPY
Products available through cTrader Store, including trading bots, indicators and plugins, are provided by third-party developers and made available for informational and technical access purposes only. cTrader Store is not a broker and does not provide investment advice, personal recommendations or any guarantee of future performance.


Price
Since 14/01/2025
55
Sales
11.48K
Free installs