
Superior Trading Sessions Indicator cTrader
Indicator
1 purchases
Version 1.0, Jun 2026
Windows, Mac
Description
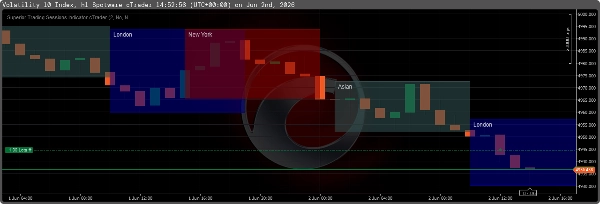
The Superior Trading Sessions Indicator is a purely technical mapping tool built natively for cTrader. It automatically calculates and visualizes major global trading sessions (Asian, London, New York, Frankfurt) alongside structural Smart Money Concepts (SMC) elements. It is designed to track liquidity pools and structural targets without cluttering price action.
Core Visualizations
- Session Rectangles: Maps the 4 major trading sessions and 4 specific high-volatility "Killzones" with adjustable transparency and crisp solid borders.
- Previous Day High/Low (PDH/PDL): Automatically plots yesterday's high and low prices as structural liquidity targets for the current live day.
- Asian Range Projections: Extends horizontal lines from the Asian High and Low forward by 16 hours to help identify liquidity sweeps during the London and New York overlap.
- Session Equilibrium: Draws a 50% midline (equilibrium) through active sessions to objectively determine Premium vs. Discount pricing regions.
- Real-Time Data: Displays the real-time pip size of the active session alongside exact High/Low price labels at the corners of the session box.
- Clutter Reduction: Includes an option to hide all historical session boxes entirely, leaving only the actively running session on the chart.
Input Parameters Explained
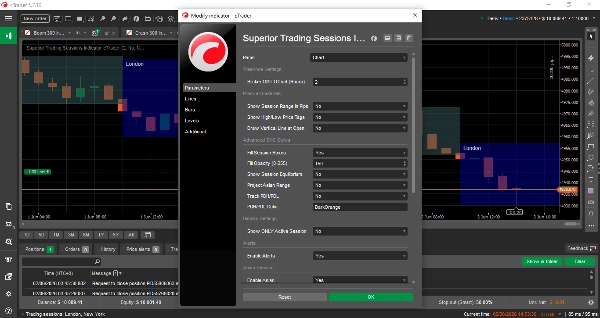
Timezone Settings
- Broker GMT Offset: (Integer) Set this to your broker's UTC/GMT offset. This ensures the standard session hours align perfectly with your broker's server time.
Premium Features
- Show Session Range in Pips: (True/False) Displays the total height of the session in pips next to the session name label.
- Show High/Low Price Tags: (True/False) Prints the exact price level at the top and bottom right corners of the session box.
- Draw Vertical Line at Open: (True/False) Draws a vertical dotted line precisely on the session's opening candle.
Advanced SMC Styles
- Fill Session Boxes: (True/False) If True, the rectangle has a shaded background. If False, the rectangle is hollow (draws the border frame only).
- Fill Opacity (0-255): Controls the transparency of the session fill. Lower values (e.g., 80) keep candlesticks visible; higher values create a darker, richer background.
- Show Session Equilibrium: (True/False) Draws a dotted line exactly at the 50% retracement level of the session.
- Project Asian Range: (True/False) Projects horizontal trendlines from the Asian High and Low across the rest of the day.
- Track PDH/PDL: (True/False) Draws solid horizontal lines marking the previous day's extreme high and low.
- PDH/PDL Color: Defines the color used for the daily liquidity lines.
Display Settings
- Show ONLY Active Session: (True/False) If True, the indicator deletes all historical drawings and only renders the session currently taking place.
Alerts & Notifications
- Enable Alerts: (True/False) Plays the native cTrader doorbell sound the exact second a new session begins.
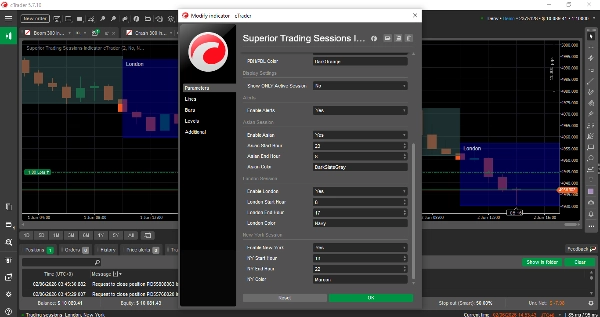
Session Timings
- Enable [Session]: Toggles the main session visibility.
- [Session] Start/End Hour: The GMT start and end times for the primary session.
- [Session] Color: The specific color applied to that session's box, text, and lines.
Summary
AI summary
The Superior Trading Sessions Indicator for cTrader is a technical charting tool that automatically maps major global trading sessions—Asian, London, New York, and Frankfurt—directly on your charts. It highlights key market periods known as "Killzones" with adjustable transparency and clear borders. The indicator plots previous day’s high and low prices as structural liquidity targets and extends Asian session range lines forward to assist in identifying liquidity sweeps during overlapping sessions.
It includes a session equilibrium line marking the 50% midpoint to help distinguish premium versus discount price zones. Real-time session pip ranges and exact high/low price labels are displayed for active sessions. Users can reduce chart clutter by showing only the current session’s data.
Configurable input parameters allow adjustment of broker GMT offset, session start/end times, colors, and display options such as filled or hollow session boxes, vertical lines at session open, and alert sounds at session start. Advanced Smart Money Concepts (SMC) features support tracking of liquidity pools and structural levels including previous day highs/lows and Asian range projections.
This indicator is designed to provide clear, structured visualization of key trading sessions and liquidity targets without obscuring price action, aiding traders in market timing and structural analysis.
Indicator profile
Indicator category
Market structure (SMC)
Output type
Visualisation
Data requirements
Tick data
Bars only
Supported signals
Session opening range
Customer reviews
0.0
Reviews: 0
Customer reviews
No reviews for this product yet. Already tried it? Be the first to tell others!
Discussion
FAQ
Fibonacci
Premium/Discount
Key Levels
BOS
Liquidity Sweep
Support & Resistance
Products available through cTrader Store, including trading bots, indicators and plugins, are provided by third-party developers and made available for informational and technical access purposes only. cTrader Store is not a broker and does not provide investment advice, personal recommendations or any guarantee of future performance.
More from this author


!["Gaussian Channel [Iridio Capital]" logo](https://cdn.ctrader.com/image/webp/7c039209-5573-4a54-a072-f9528b503103_41960)
Price
26
Sales