
SSL Channel
Indicator
3 purchases
Version 1.2, Jan 2026
Windows, Mac
5.0
Reviews: 1
Description
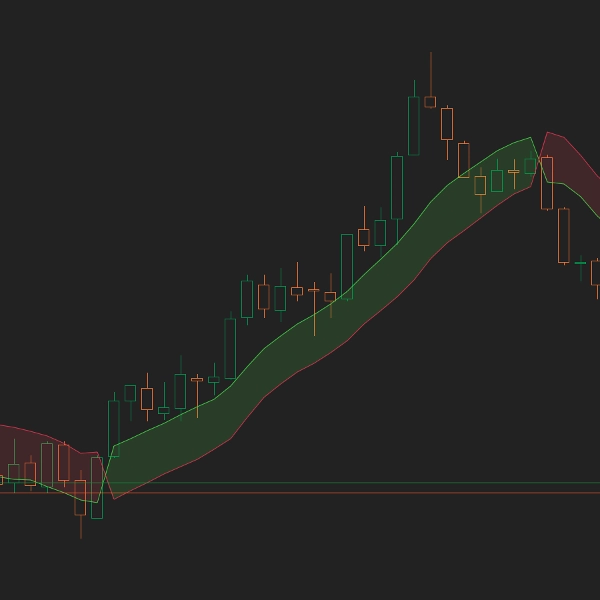
Confused about market direction? SSL Channel uses dual moving averages to create an unambiguous visual representation of trend - green cloud means buy, red cloud means sell. Pure, simple, effective.
Key Features
- Dual MA Trend Detection: Uses separate moving averages on highs and lows to determine trend direction, eliminating the ambiguity of single MA systems
- Visual Cloud Confirmation: Semi-transparent cloud fills the space between Bull and Bear lines, giving you instant visual confirmation of the current trend state
- Smart Color Logic: When close is above the high MA, Bulls turn green and move to the top. When close is below the low MA, Bears turn red and take the top position
- Optional Alerts: Enable popup notifications and sound alerts when the Bull and Bear lines cross, signaling a potential trend change
- Multiple MA Types: Choose from Simple, Exponential, Smoothed, or Weighted moving averages to match your trading style
How It Works
The SSL Channel calculates two moving averages: one on the highs, one on the lows. The indicator then compares the current close price to these levels:
- Bullish Trend: When close > High MA, the Bulls line (green) moves to the top and Bears line (red) moves to the bottom
- Bearish Trend: When close < Low MA, the Bears line (red) moves to the top and Bulls line (green) moves to the bottom
The cloud between these lines visually reinforces the trend - trade in the direction of the top-colored line for the highest probability setups.
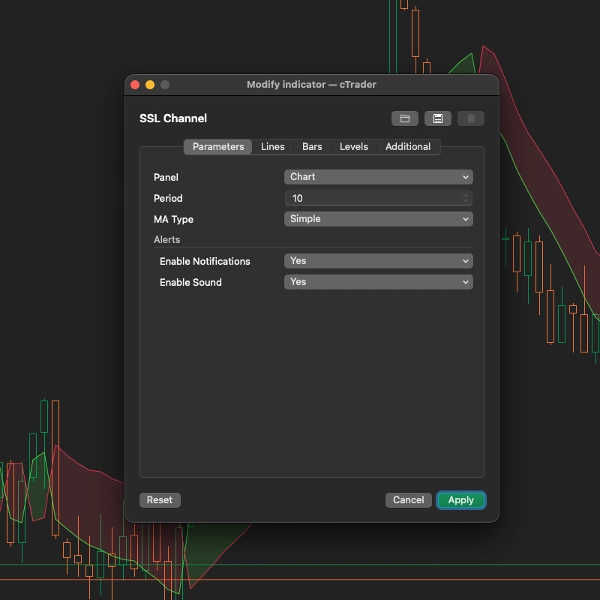
Parameters
- Period (Default: 10): Number of bars for the moving average calculation. Lower = more responsive, Higher = smoother signals
- MA Type (Default: Simple): Choose the moving average calculation method - Simple, Exponential, Smoothed, Weighted, or other available types
- Enable Notifications (Default: False): Show popup alerts when lines cross over
- Enable Sound (Default: False): Play sound when lines cross over
Ideal For
- Trend traders who want clear, unambiguous signals
- Traders using breakout or pullback strategies
- Those who prefer visual, chart-based trading over screen watching
- Anyone wanting a simple trend filter for their existing system
Trading Tips
- Trend Filter: Only take long trades when Bulls (green) are on top, shorts when Bears (red) are on top
- Pullback Entries: Wait for price to pull back to the cloud, then enter in the direction of the trend
- Crossover Signals: The crossover of Bull and Bear lines marks the trend change - use this as an entry or exit signal
- Timeframes: Works on M15 for scalping to H4/D1 for swing trading
Pro Tips
- Combine with volume for confirmation - crossovers with high volume are more reliable
- Use in conjunction with support/resistance levels for higher-probability entries
- The Period parameter can be optimized per symbol - test different values on each pair you trade
Summary
AI summary
The SSL Channel is a trend-following indicator designed for scalpers and day traders seeking clear, early signals of market direction changes. It uses two moving averages—one calculated on highs and another on lows—to define bullish and bearish trends. When the closing price is above the high moving average, the indicator displays a green "Bulls" line on top and a red "Bears" line below, signaling an uptrend. Conversely, when the close is below the low moving average, the red "Bears" line moves to the top and the green "Bulls" line to the bottom, indicating a downtrend. A semi-transparent cloud fills the space between these lines, providing an immediate visual confirmation of the current trend.
Traders can customize the moving average type (Simple, Exponential, Smoothed, Weighted) and the period length to suit their trading style. Optional popup and sound alerts notify users of line crossovers, marking potential trend shifts. The SSL Channel supports multiple markets including Forex, indices, and cryptocurrencies, and is suitable for use on timeframes from 15 minutes to daily charts. It can be used standalone or combined with other systems for confirmation, aiding in breakout, pullback, and trend-following strategies. The indicator is simple to apply—just add it to the chart, adjust settings, and trade accordingly.
Traders can customize the moving average type (Simple, Exponential, Smoothed, Weighted) and the period length to suit their trading style. Optional popup and sound alerts notify users of line crossovers, marking potential trend shifts. The SSL Channel supports multiple markets including Forex, indices, and cryptocurrencies, and is suitable for use on timeframes from 15 minutes to daily charts. It can be used standalone or combined with other systems for confirmation, aiding in breakout, pullback, and trend-following strategies. The indicator is simple to apply—just add it to the chart, adjust settings, and trade accordingly.
Indicator profile
Customer reviews
5.0
Reviews: 1
5 | 100 % | |
4 | 0 % | |
3 | 0 % | |
2 | 0 % | |
1 | 0 % |
Discussion
FAQ
BTCUSD
Forex
Breakout
Scalping
Indices
EURUSD
GBPUSD
NZDUSD
Crypto
XAUUSD
NAS100
USDJPY
Products available through cTrader Store, including trading bots, indicators and plugins, are provided by third-party developers and made available for informational and technical access purposes only. cTrader Store is not a broker and does not provide investment advice, personal recommendations or any guarantee of future performance.
More from this author


Price
Since 04/04/2025
8
Sales
1.94K
Free installs