
Description
The Problem
Standard moving averages have a fundamental flaw: they use fixed time periods. When the market speeds up, they lag. When it slows down, they whipsaw. You're always trading with the wrong responsiveness.
The Solution
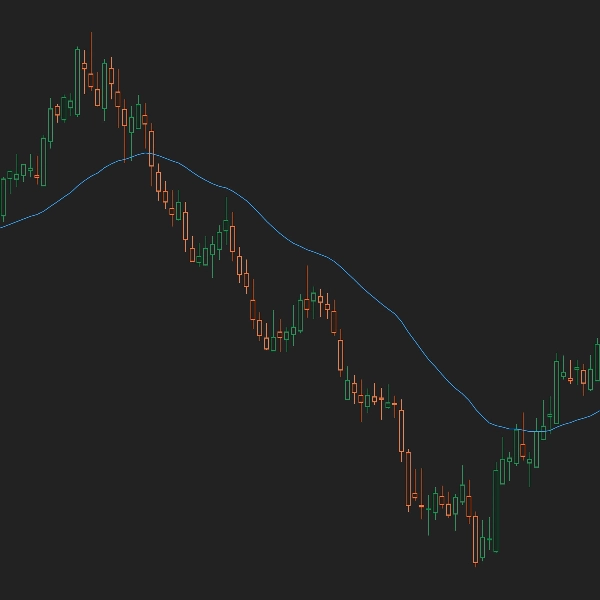
McGinley Dynamic is an adaptive moving average that automatically adjusts to market speed. It tracks price closely during fast trends and slows down during choppy periods—reducing both lag and false signals in a single indicator.
Key Features
- Adaptive to Market Speed: Automatically adjusts responsiveness based on current volatility and price movement
- Reduced Lag: Tracks price more closely than traditional MAs during trending conditions
- Fewer Whipsaws: Slows down during choppy markets to avoid false signals
- Simple Parameters: Just two settings—Length and Constant—for full control
- Clean Visual: Single smooth line that works as dynamic support/resistance
How It Works
The McGinley Dynamic uses a unique formula that incorporates the ratio of current price to the previous value. This allows it to speed up when price moves strongly and slow down when price consolidates. Unlike traditional EMAs or SMAs that use fixed periods, McGinley "listens" to the market and adapts accordingly.
The formula:
McGinley = Prev + (Price - Prev) / (Constant × Length × (Price / Prev)^4)
When price moves rapidly, the ratio increases and the MA responds faster. When price consolidates, the ratio decreases and smoothing increases.
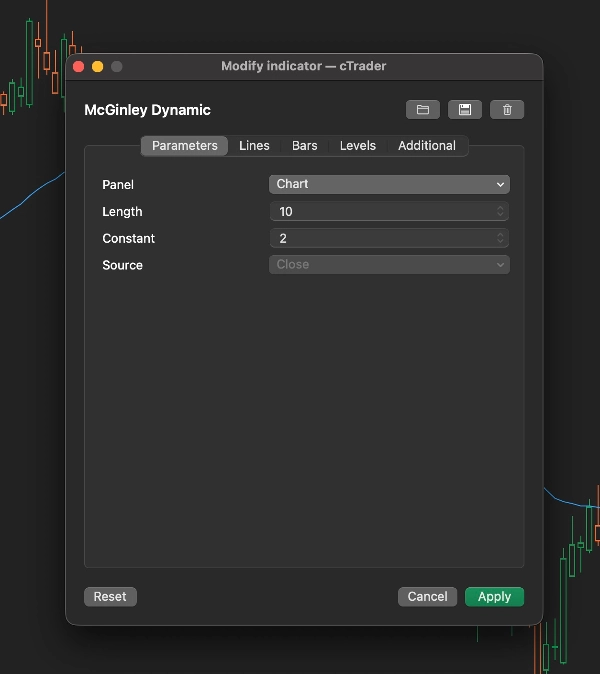
Parameters
Length: Base period for smoothing (default: 14). Lower = faster, Higher = smoother
Scaling factor: (default: 1.0). Higher values = more aggressive adaptation
Source: Price series to calculate on (default: Close)
Ideal For
- Trend traders who want a baseline that adapts to market conditions
- Traders tired of MA whipsaws in ranging markets
- Anyone wanting cleaner trend signals than traditional moving averages
Trading Tips
- Trend Filter: Only trade long when price is above McGinley, short when below
- Support/Resistance: Use the line as dynamic S/R—bounces often become entries
- Trend Confirmation: Price crossing above/below McGinley signals potential trend change
- Combo Works: Pair with SSL Channel or Coral for confirmation
Requirements
- Timeframe: All timeframes supported (M5 to D1)
- Symbols: Forex, Indices, Metals, Stocks
- Account Type: Any
Summary
Key features include:
- Automatic adaptation to market speed for improved tracking of price trends.
- Reduced lag and fewer whipsaws compared to standard moving averages.
- Simple parameter settings with just Length and Constant for customization.
- A clean, single smooth line that can act as dynamic support or resistance.
The indicator uses a unique formula incorporating the ratio of current price to its previous value, allowing it to speed up during rapid price moves and slow down during consolidation phases. It supports all timeframes from 5 minutes to daily and is applicable across Forex, Indices, Metals, and Stocks markets.
Traders can use the McGinley Dynamic as a trend filter, dynamic support/resistance line, and for trend confirmation by observing price crossings. It can also be combined with other indicators like SSL Channel or Coral for enhanced analysis.
Customer reviews
5 | 0 % | |
4 | 100 % | |
3 | 0 % | |
2 | 0 % | |
1 | 0 % |


