Description
Heikin Ashi Structure Bias (cTrader Indicator)
Automatic supply–demand zones with multi-timeframe bias.
What it does – in plain English
This indicator automatically:
- Reads Heikin Ashi price action and detects meaningful pivot shifts.
- Builds dynamic support and resistance zones around those pivots, using both the wick extreme and the candle body (not just random lines).
- Merges nearby zones intelligently so you see clean, tradable levels instead of a forest of horizontal lines.
- Generates a clear bullish or bearish bias whenever price fully breaks the latest support or resistance zone.
- Shows you the bias for:
- Your chart timeframe, and
- An optional higher timeframe (default H2) — without drawing HTF clutter on your chart.
Result: one glance tells you where the real levels are and whether the market is currently leaning up or down.
The problem it solves
Most traders have the same issues:
- Support/resistance lines drawn by hand are:
- subjective,
- inconsistent,
- and often overdone.
- Simple “zigzag + horizontal line” indicators:
- don’t handle zone width properly,
- stack levels on top of each other,
- or extend zones so far they cover half the chart.
- Bias is often “in your head” – not something you can clearly see or use in a rule-based way.
This indicator is built to:
- Turn Heikin Ashi structure into clear, objective zones,
- Give you a rule-based trend/bias based on those zones,
- While keeping the chart clean and readable.
How the zones are built (trader-friendly explanation)
For each Heikin Ashi pivot, the indicator looks at a 3-candle structure:
- When HA flips from red to green, it marks a support pivot.
- When HA flips from green to red, it marks a resistance pivot.
Then it builds the zone:
Support zones
- Finds the lowest wick among the 3 candles (true extreme).
- Finds the next-lowest low that’s still higher than that extreme.
- Uses the candle body (open/close) near that inner low to define the “tradable” side of the zone.
- Final support zone:
- Bottom = extreme wick low,
- Top = body-based inner level.
Resistance zones
- Finds the highest wick among the 3 candles.
- Finds the next-highest high that’s still lower than that extreme.
- Uses the body near that inner high.
- Final resistance zone:
- Top = extreme wick high,
- Bottom = body-based inner level.
So each zone is not just an arbitrary band:
It’s a wick-to-body range that represents where price really rejected or reversed.
Merging logic (why the chart stays clean)
Zones of the same type (support with support, resistance with resistance):
- Are treated as units on a timeline.
- Can only merge if they actually overlap in price.
- Merging is strictly local:
- A new zone can merge with:
- the most recent zone (back-to-back), or
- the second-most recent zone (+1 gap), and
- One additional “anchor” merge behind that if the new combined zone now overlaps the previous structure.
This keeps behaviour intuitive:
- Zones don’t “swallow” the entire history.
- Older levels are respected but not allowed to create giant mega-zones.
- Local structure like A–B–C or A–C+D is handled in a controlled way.
Bias logic (how you actually trade with it)
For each timeframe (main and HTF):
- The indicator tracks the latest merged support zone and the latest merged resistance zone.
- Then, on each closed candle:
- If price closes above the latest resistance zone → bias becomes Bullish.
- If price closes below the latest support zone → bias becomes Bearish.
It stores:
- The time of the last bias flip,
- The price level at which price broke the zone.
On the chart, a small text panel shows:
Main (H1) Bias: BullishMain (H1) Shift: 11/26 15:00 @1.08750
If HTF is enabled, you’ll also see something like:
HTF (H2) Bias: BearishHTF (H2) Shift: 11/25 08:00 @1.09200
You can also enable a sound alert when the main timeframe bias flips.
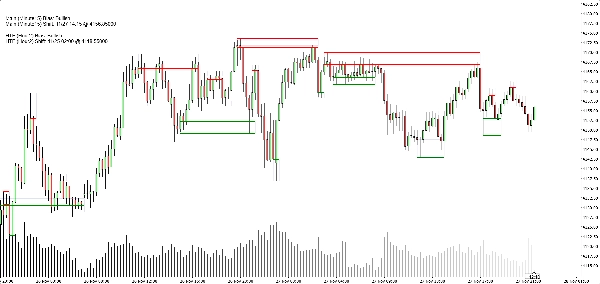
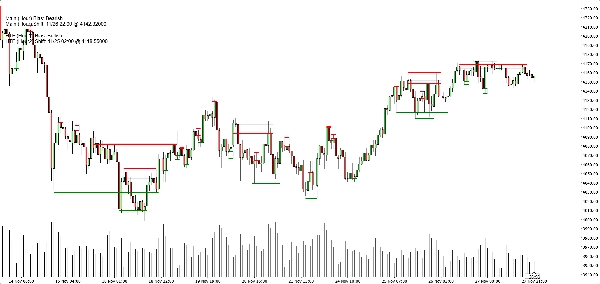
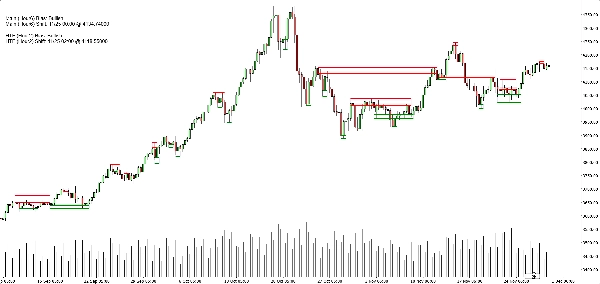
What you see on the chart
- Support zones:
- Green horizontal base/trigger lines (optional),
- A soft navy rectangle (very low opacity) showing the full support band.
- Resistance zones:
- Red lines + soft navy rectangle for the band.
- Clean display toggles:
- Show/hide support zones,
- Show/hide resistance zones,
- Turn the filled rectangles on/off,
- Turn the base/trigger lines on/off,
- Turn the bias panel on/off.
This lets different traders choose between:
- A more minimalist look (maybe just rectangles), or
- A more precise view (exact lines visible).
Typical use cases
You can position it as useful for:
- Trend filtering
- Only look for buys when both main TF and HTF biases are Bullish.
- Only look for sells when both are Bearish.
- Zone entries
- Use the zones as areas of interest for:
- Limit orders,
- Confirmation entries (e.g. price returns to a broken zone and rejects again),
- Stop placement just beyond the outer band.
- Top-down analysis
- HTF bias (H2 by default) as the big picture,
- Chart TF bias for timing,
- Zones for concrete execution levels.
What it is NOT (important for honest selling)
- It’s not a robot that auto-trades for you.
- It’s not a “holy grail” signal that guarantees profit.
- It’s a structure and bias engine:
- Objectively defines zones,
- Objectively defines trend/bias based on those zones,
- Leaves actual trade management to the trader/strategy.
Summary
Customer reviews
5 | 33 % | |
4 | 67 % | |
3 | 0 % | |
2 | 0 % | |
1 | 0 % |