
Описание
HIO Inside Bar Scanner Free: Ваш лучший бесплатный охотник за Inside Bar на cTrader!
1. Введение Хотите испытать мощь системной торговли Price Action без затрат? HIOInsideBarScanner Free — идеальный многофреймовый сканер для вас! Оптимизированный для cTrader, этот инструмент автоматически обнаруживает высоковероятные паттерны Inside Bar на вашем активном графике, гарантируя, что вы никогда не пропустите важный прорыв рынка.
2. Основные функции
- Панель многофреймового мониторинга: Отслеживайте ценовое движение текущего символа одновременно на нескольких таймфреймах (например, M15, H1, D1) через одну компактную сетку.
- Точные прорывы: Получайте точные лог-уведомления, когда цена пробивает Inside Bar или Mother Bar, включая высокоточное обнаружение ложных пробоев (ловушек).
- Автоматическая визуализация: Автоматически рисует четкие границы для Mother Bars (MB) и Inside Bars (IB), а также стрелки сигналов направления прямо на основном графике.
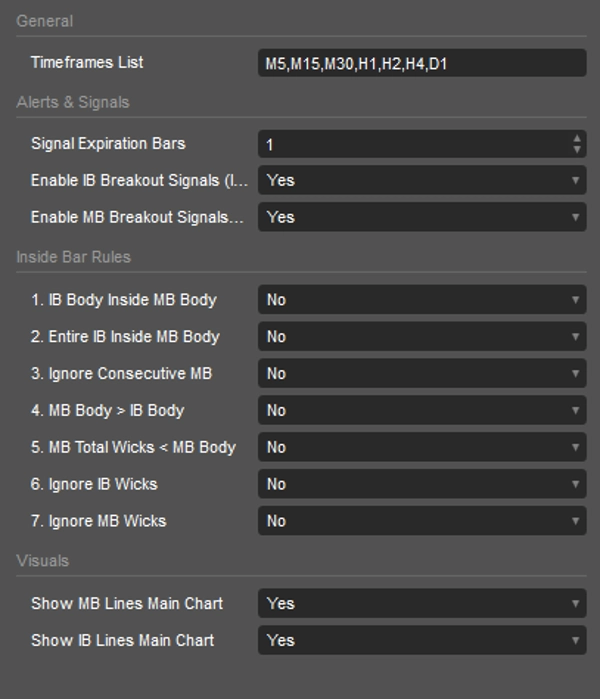
3. Руководство по настройке и разбор параметров
Даже в бесплатной версии этот индикатор сохраняет 100% продвинутой логики фильтрации, чтобы вы могли адаптировать его под свою стратегию:
- Общие настройки:
-
- Список таймфреймов: Определите свой подход, введя предпочитаемые таймфреймы для сканирования на текущем графике (например, H1, H4, D1).
- Оповещения и сигналы:
-
- Срок действия сигналов: Определите, сколько баров сигнал прорыва остается действительным. Избегайте поздних входов при ослаблении импульса!
- Включить сигналы прорыва IB (IBI/IBIF): Включите, чтобы получать оповещения при пробое границ Inside Bar (включая обнаружение ложных пробоев).
- Включить сигналы прорыва MB (IB/IBF): Активируйте оповещения о настоящих прорывах Mother Bar — сильное подтверждение направления тренда.
- Правила умного Inside Bar:
-
- Тело IB внутри тела MB: Строгий фильтр, требующий полного нахождения тела Inside Bar внутри тела Mother Bar.
- Весь IB внутри тела MB: Весь Inside Bar (включая фитили) должен полностью помещаться внутри тела Mother Bar.
- Игнорировать последовательные MB: Пропускает последовательные Mother Bars, чтобы сосредоточиться только на свежих паттернах.
- Тело MB > тела IB: Обеспечивает, что тело Mother Bar больше тела IB.
- Общие фитили MB < тело MB: Фильтрует нечеткие Mother Bars, гарантируя, что суммарный размер фитилей меньше тела.
- Игнорировать фитили IB/MB: Заставляет сканер рассчитывать прорывы исключительно на основе цен открытия/закрытия свечей.
- Визуализация:
-
- Показывать линии MB/IB на основном графике: Автоматически рисуйте чистые, цветные границы для MB и IB прямо на вашем графике.
4. Руководство по символам панели: Читайте рынок с первого взгляда Панель использует интуитивно понятные, цветовые символы, чтобы помочь вам мгновенно понять текущие ценовые движения :
- IB: Образовался новый Inside Bar. (Будьте готовы!)
- IBI▲: Цена закрылась выше максимума Inside Bar.
- IBI▼: Цена закрылась ниже минимума Inside Bar.
- IBIF▲: Цена пробила ниже минимума Mother Bar, затем развернулась и закрылась выше максимума Inside Bar. (Медвежий ложный пробой)
- IBIF▼: Цена пробила выше максимума Mother Bar, затем развернулась и закрылась ниже минимума Inside Bar. (Бычий ложный пробой)
- IB▲: Цена закрылась выше максимума Mother Bar. (Сильный бычий прорыв)
- IB▼: Цена закрылась ниже минимума Mother Bar. (Сильный медвежий прорыв)
- IBF▲: Цена пробила ниже минимума Mother Bar, затем резко развернулась и закрылась выше максимума Mother Bar. (Крупная медвежья ловушка)
- IBF▼: Цена пробила выше максимума Mother Bar, затем резко развернулась и закрылась ниже минимума Mother Bar. (Крупная бычья ловушка)


![Логотип продукта "[Stellar Strategies] Smart ADX"](https://cdn.ctrader.com/image/webp/af13b084-b6f6-41db-b7bc-c7e688b57b05_36929)


