

说明
TSPivotSMC-V2:经典枢轴点与机构流动性的融合
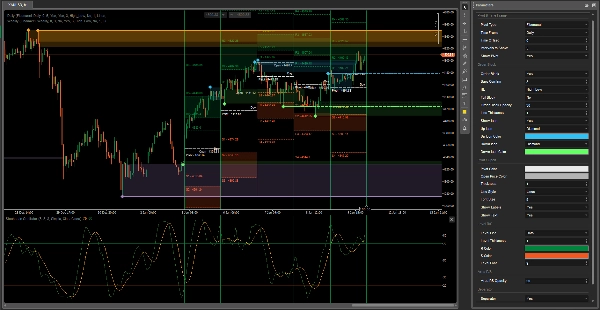
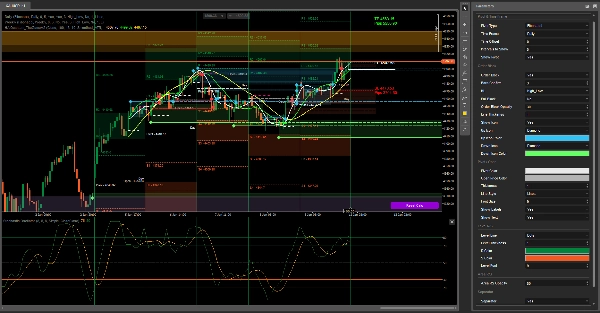
TSPivotSMC-V2 不仅仅是另一个枢轴点指标;它是一个为寻求机构精确度的交易者设计的先进智能资金概念(SMC)地图。我们将经典技术分析中最受信赖的工具转变为流动性检测引擎和高概率区域。
主要特点:
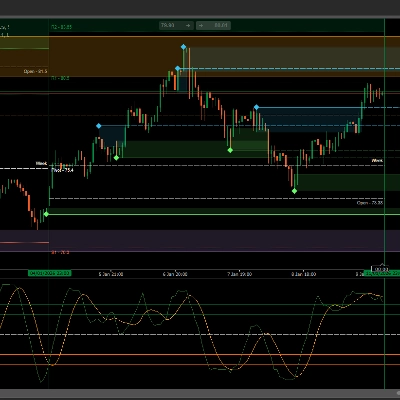
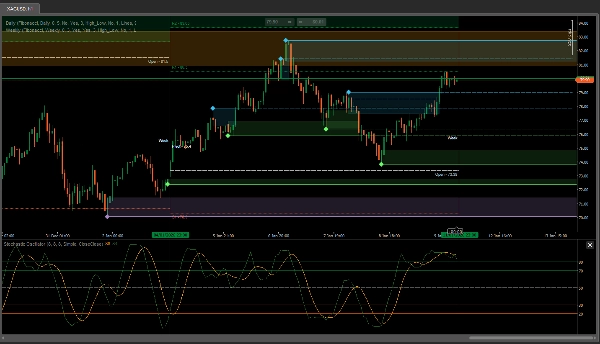
• 自动会话订单区块:识别并绘制前一交易会话的高低点矩形,标记关键的供需区域。
• 智能缓解管理:指标检测价格何时突破区块,将实心矩形更改为虚线参考线。这使您能够保持图表整洁,同时保留历史突破。
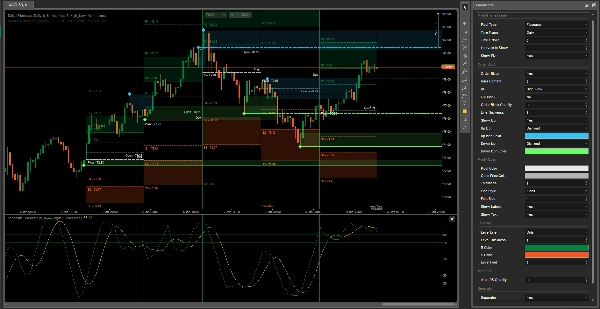
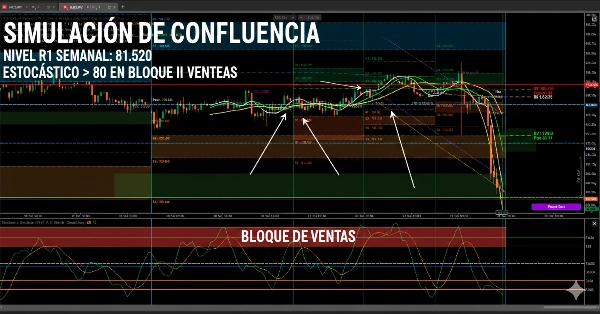
• 多时间框架(MTF)层级:设计为分层工作。您可以应用每日实例以实现精确入场,应用每周实例以定义市场偏向,从而看到高影响力的汇聚点。
• 专业确认:包含烛台确认过滤器(Bars Confirm),确保流动性区域有效,而非仅仅是市场噪音。
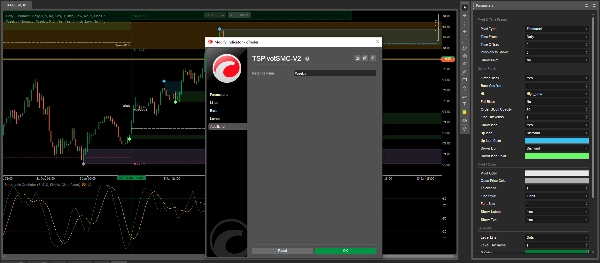
• 完全美学自定义:可独立配置每个时间框架的颜色、不透明度和线条样式,便于在压力下快速读取价格。
为什么选择TSPivotSMC?
传统枢轴点只给你数字,而TSPivotSMC-V2给你市场叙事。通过结合数学的斐波那契/标准水平与机构价格行为,您可以看到资金所在及其何时被缓解,从而在cTrader上获得独特的竞争优势。
商店用户注意:“建议使用两个指标实例(每日和每周)以最大化高时间框架流动性分析的效果。”
摘要
AI 摘要
TSPivotSMC-V2 is an advanced trading indicator that integrates classical pivot points with Smart Money Concepts (SMC) to identify institutional liquidity zones. It automatically detects and highlights previous session order blocks—key supply and demand areas—using rectangles on the chart. When price breaks these blocks, the indicator switches the display from solid rectangles to dashed lines, preserving historical breakout information while maintaining chart clarity.
Designed for multi-timeframe analysis, TSPivotSMC-V2 supports layering daily and weekly instances to refine entry points and define overall market bias. It includes a candlestick confirmation filter to validate liquidity zones and reduce noise. Users can customize colors, opacities, and line styles independently for each timeframe to enhance visual clarity under trading pressure.
By combining mathematical pivot levels with institutional price action, this tool provides a detailed market narrative, helping traders identify where liquidity resides and when it has been mitigated. It is applicable across multiple markets including Forex, indices, commodities, cryptocurrencies, and stocks. Using multiple timeframe instances is recommended to maximize liquidity analysis effectiveness.
Designed for multi-timeframe analysis, TSPivotSMC-V2 supports layering daily and weekly instances to refine entry points and define overall market bias. It includes a candlestick confirmation filter to validate liquidity zones and reduce noise. Users can customize colors, opacities, and line styles independently for each timeframe to enhance visual clarity under trading pressure.
By combining mathematical pivot levels with institutional price action, this tool provides a detailed market narrative, helping traders identify where liquidity resides and when it has been mitigated. It is applicable across multiple markets including Forex, indices, commodities, cryptocurrencies, and stocks. Using multiple timeframe instances is recommended to maximize liquidity analysis effectiveness.
指标配置
客户评价
5.0
评价:2
5 | 100 % | |
4 | 0 % | |
3 | 0 % | |
2 | 0 % | |
1 | 0 % |
客户评价
January 19, 2026
good enough to keep watching for another week. A rushed entry can still spoil the trade.
January 14, 2026
The review feels more structured, but it needs a few bad trades in the sample too.
讨论
常见问答
Prop
Forex
Indices
Commodities
Crypto
Stocks
cTrader Store 提供的所有产品,包括交易机器人、指标和插件,均由第三方开发者提供,仅供信息参考和技术访问之用。cTrader Store 并非经纪商,不提供投资建议、个人推荐或任何未来业绩保证。









猜您喜欢


















价格
150
销售
11.33K
免费安装