Descrizione
🚀 HAI Quantum V4 | Cruscotto di Trading ad Alte Prestazioni con Chiarezza Visiva Incomparabile
Analisi Quantistica Semplificata: Se il pattern è presente, V4 lo troverà per te.
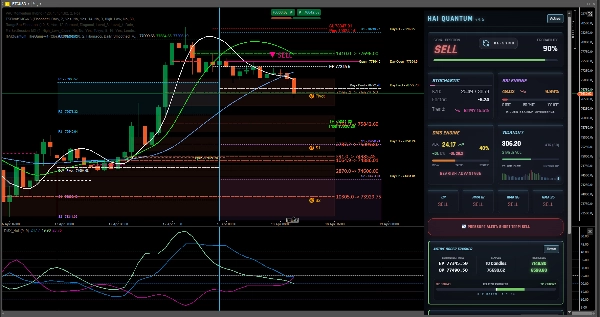
HAI Quantum V4 rappresenta l'apice del design professionale dell'interfaccia di trading, progettato per eliminare il rumore di mercato. Mentre altri trader faticano con grafici confusi, l'utente V4 gode di un vantaggio sleale: una visualizzazione ultra-chiara e in tempo reale dell'azione del prezzo e della liquidità.
Abbiamo progettato questo cruscotto per rendere quasi impossibile perdere un'opportunità. Se, dopo aver osservato i segnali forniti da HAI Quantum V4, non riesci a identificare il setup di trading, è un chiaro segno per restare in disparte o rivedere il tuo approccio complessivo. Abbiamo distillato la complessità matematica nella sua forma visiva più semplice affinché tu possa concentrarti esclusivamente sull'esecuzione decisiva.
💎 Vantaggi Chiave di HAI Quantum V4:
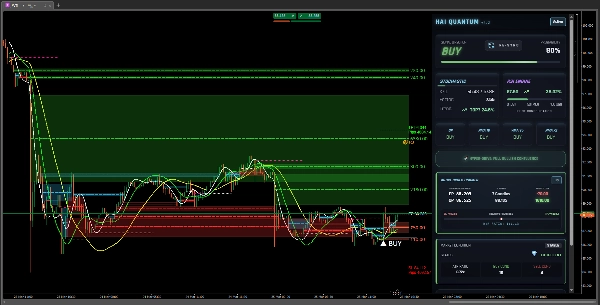
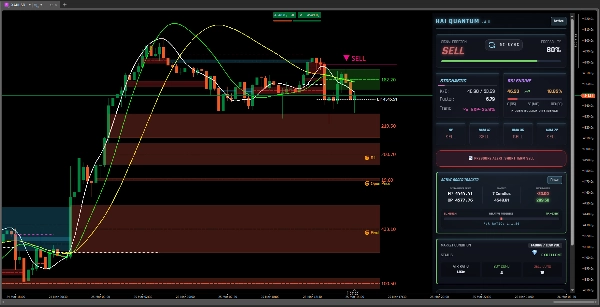
- Visualizzazione Istantanea del Pattern: Smetti di tracciare linee manualmente. Il pannello evidenzia zone ad alta probabilità e la direzione del flusso degli ordini in tempo reale.
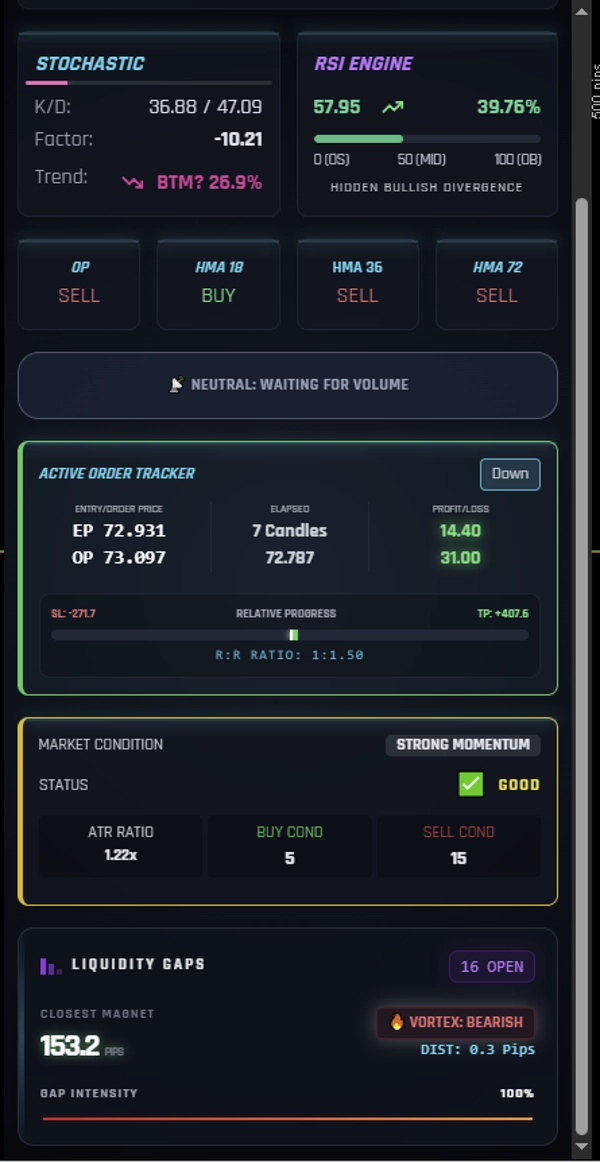
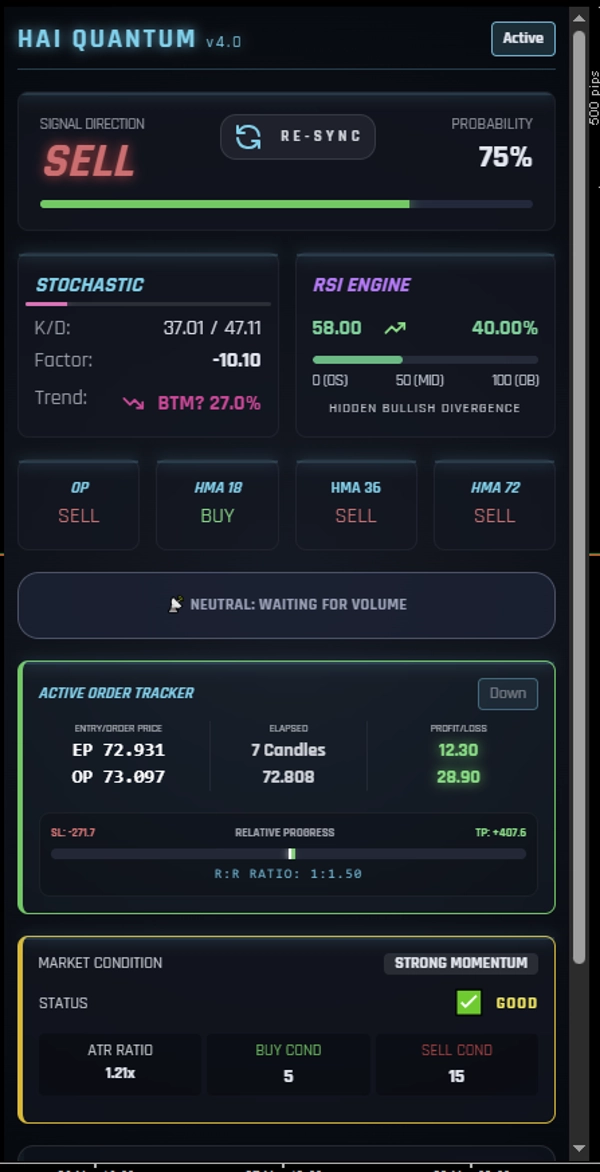
- Analisi Multidimensionale: Integra senza soluzione di continuità un Motore Stocastico, un Motore RSI e l'allineamento della Media Mobile Hull (HMA) in un'interfaccia unica e pulita.
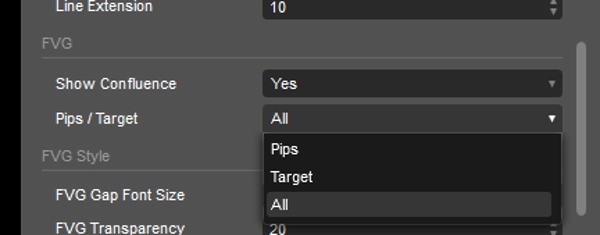
- Personalizzazione Totale: Sebbene preconfigurato come una "macchina di segnali" pronta all'uso, tutti i parametri sono completamente regolabili. Il pannello si adatta al tuo stile di trading, non il contrario.
- Gestione Visiva del Rischio: Monitora senza sforzo il rapporto Rischio/Rendimento (R:R) e il progresso in tempo reale dei tuoi ordini attivi.
- Stato delle Condizioni di Mercato: Ricevi indicatori chiari di basso volume vs. allineamento rialzista/ribassista completo ("Hyper-drive" / "Meltdown") per assicurarti di non operare mai alla cieca.
📈 Provato e Validato su Molti Mercati
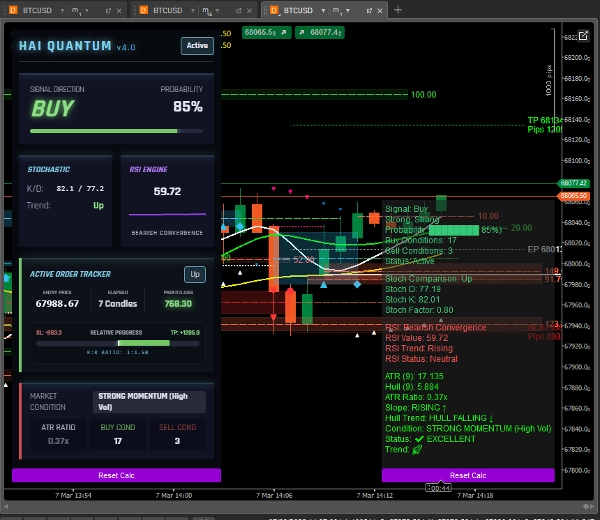
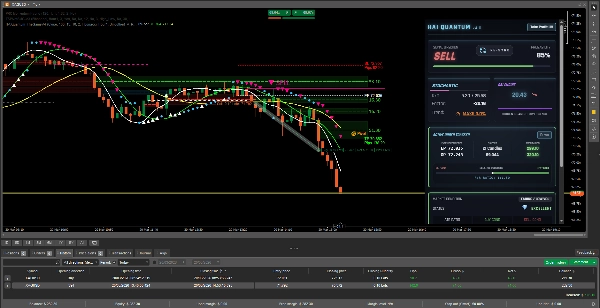
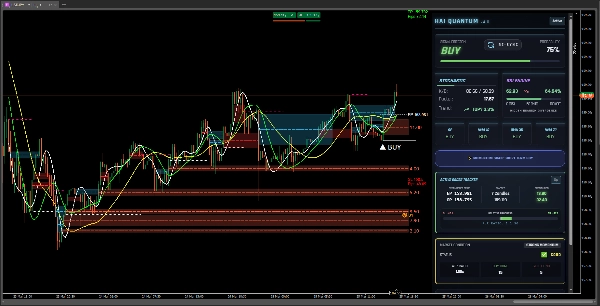
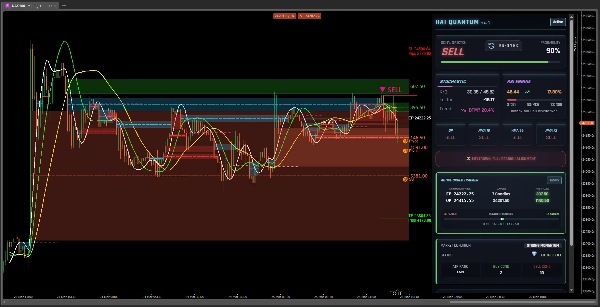
La versatilità dell'algoritmo HAI Quantum V4 è stata validata sugli asset più esigenti e liquidi al mondo. Come mostrato nelle immagini allegate, il pannello offre chiarezza e precisione costanti su:
- Forex (Major): Ad esempio, EURUSD. Identifica micro-trend e liquidità nella coppia più scambiata.
- Forex (Cross ad Alta Volatilità): Ad esempio, USDJPY. Rileva congiunzioni rialziste o ribassiste critiche nelle coppie basate sullo Yen.
- Commodity (Energia): Ad esempio, WTI Crude Oil. Individua pattern chiave in un mercato guidato da fattori macroeconomici.
- Metalli Preziosi: Ad esempio, XAUUSD (Oro). Filtra il rumore tecnico in un asset rifugio sofisticato.
Un cruscotto. Una configurazione robusta. Risultati coerenti in qualsiasi mercato.
🛠 Come Usare:
- Analizza: Osserva le sezioni "Direzione Segnale" e "Probabilità" sul cruscotto.
- Conferma: Verifica l'allineamento tecnico nella sezione "Condizione di Mercato" e nei motori RSI/Stocastico.
- Esegui: Se tutti gli indicatori convergono, il pattern è chiaro. Esegui il tuo trade e gestisci il rischio di conseguenza.
✅ Perché Scegliere HAI Quantum V4?
Perché nel trading, la chiarezza è profitto. Questo strumento è stato perfezionato per garantire che ogni trader—dal principiante al professionista—possa ottenere rendimenti costanti basati su un'analisi matematica e visiva impeccabile.
💎 Funzionalità Analitiche Avanzate (Aggiornamento V4.5)
📊 Motore DMS: Il Radar del Trend
Il DMS (Directional Movement System) agisce come il filtro di convinzione definitivo. Mentre altri indicatori mostrano solo la direzione, il DMS misura la forza dietro il movimento:
- ADX (Average Directional Index): Quantifica l'intensità del trend. Un ADX alto conferma che il mercato ha l'inerzia necessaria per raggiungere i tuoi obiettivi di Take Profit (TP), mentre un ADX basso avverte di pericolosi range laterali.
- DMI (+DI / -DI): Visualizza la battaglia in tempo reale tra compratori e venditori. La sezione Vantaggio Rialzista/Ribassista ti dice immediatamente chi controlla il flusso degli ordini.
⚡ Volatilità & Flusso di Volume: Il Polso del Mercato
Perché un segnale sia valido, ha bisogno di "carburante". Il nuovo pannello Volatilità assicura che tu non entri in mercati "morti":
- ATR (Average True Range): Fornisce una lettura precisa dell'intervallo di prezzo previsto, permettendoti di impostare Stop Loss tecnici anziché emotivi.
- Flusso di Volume (Asciugamento / Hyper-drive): Monitora se il volume sta entrando o uscendo dall'asset. Se il segnale dice "Vendi" ma il volume si sta "Asciugando", il sistema ti avverte di aspettare, proteggendo il tuo capitale da falsi breakout.
🧠 Come Questo Completa l'Analisi di Mercato
L'integrazione di DMS e Volatilità crea un imbuto decisionale infallibile:
- Direzione (Il "Cosa"): La Direzione Segnale e l'allineamento HMA definiscono se cercare Acquisti o Vendite.
- Momento (Il "Quando"): I motori RSI e Stocastico individuano il punto di ingresso ottimale (ipercomprato/ipervenduto).
- Convinzione (Il "Perché"): Il Motore DMS conferma se quella direzione ha abbastanza forza istituzionale dietro.
- Sicurezza (Il "Quanto"): Il pannello Volatilità determina se le condizioni di mercato sono stabili o erratiche, aiutandoti a decidere la dimensione della posizione o se è meglio rimanere Neutrale: In Attesa del Volume.
Il Verdetto: Con queste aggiunte, HAI Quantum V4 non ti dice più solo dove sta andando il prezzo, ma quanto velocemente e quanto probabilmente raggiungerà la sua destinazione. È la differenza tra seguire un'intuizione ed eseguire un piano basato su dati matematici ad alta fedeltà.
🛠 Flusso di Lavoro Aggiornato:
- Analizza: Osserva il segnale e la percentuale di probabilità.
- Valida (DMS): L'ADX è sopra 20-25? Il +DI/-DI conferma il vantaggio?
- Filtra (Volatilità): C'è volume sufficiente? Se lo stato è "Neutrale", la pazienza è il tuo miglior strumento.
- Esegui: Quando direzione, forza e volume convergono, l'esecuzione diventa un processo senza stress.
🔥 La Filosofia V4: Trading per Trader Orientati ai Risultati
"Il trading di successo non dovrebbe essere un enigma. Se non riesci a vedere il pattern con l'assistenza di HAI Quantum V4, è meglio non fare trading. La nostra missione è garantire che il profitto diventi l'esito logico di un'interpretazione semplice e precisa."
Riepilogo
Key features include full parameter customizability, visual risk management with real-time tracking of risk/reward ratios and active orders, and clear market condition indicators that distinguish between low volume and strong bullish or bearish trends. The indicator supports multiple asset classes such as major and high-volatility Forex pairs (e.g., EURUSD, USDJPY), commodities like WTI Crude Oil, and precious metals including Gold (XAUUSD).
An advanced Directional Movement System (DMS) engine measures trend strength and buyer-seller dynamics, while a volatility panel monitors market pulse through ATR and volume flow metrics to filter out weak signals. The tool guides users through a structured workflow: analyze signals, validate trend strength, filter by volatility, and execute trades based on converging indicators. This approach aims to enhance decision-making by providing clear, mathematically grounded insights into market direction, momentum, conviction, and safety.
Recensioni dei clienti
5 | 75 % | |
4 | 25 % | |
3 | 0 % | |
2 | 0 % | |
1 | 0 % |