
Beschreibung
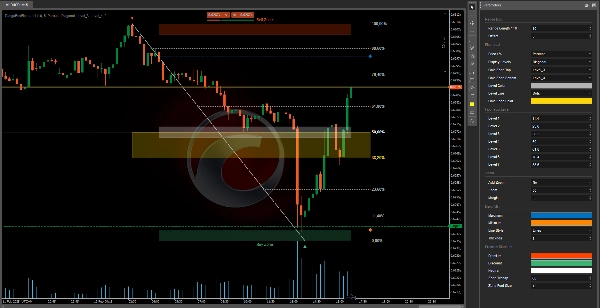
Dieser Fibonacci-Retracement-Indikator ermöglicht es Tradern, wichtige Retracement-Level zu visualisieren und anzupassen, um potenzielle Kauf- und Verkaufszonen im Markt zu identifizieren.
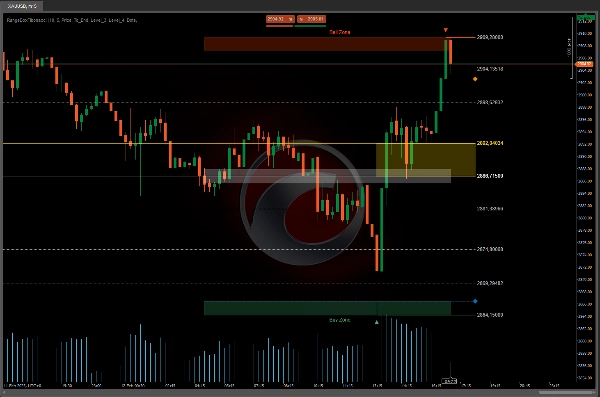
Zusätzlich zu den farbigen „Verkaufszone“ und „Kaufszone“ können Benutzer die Fibonacci-Level nach Belieben anpassen.
Dieser Indikator wird durch einen separaten Alarm-Indikator für ein umfassenderes Handelserlebnis ergänzt.
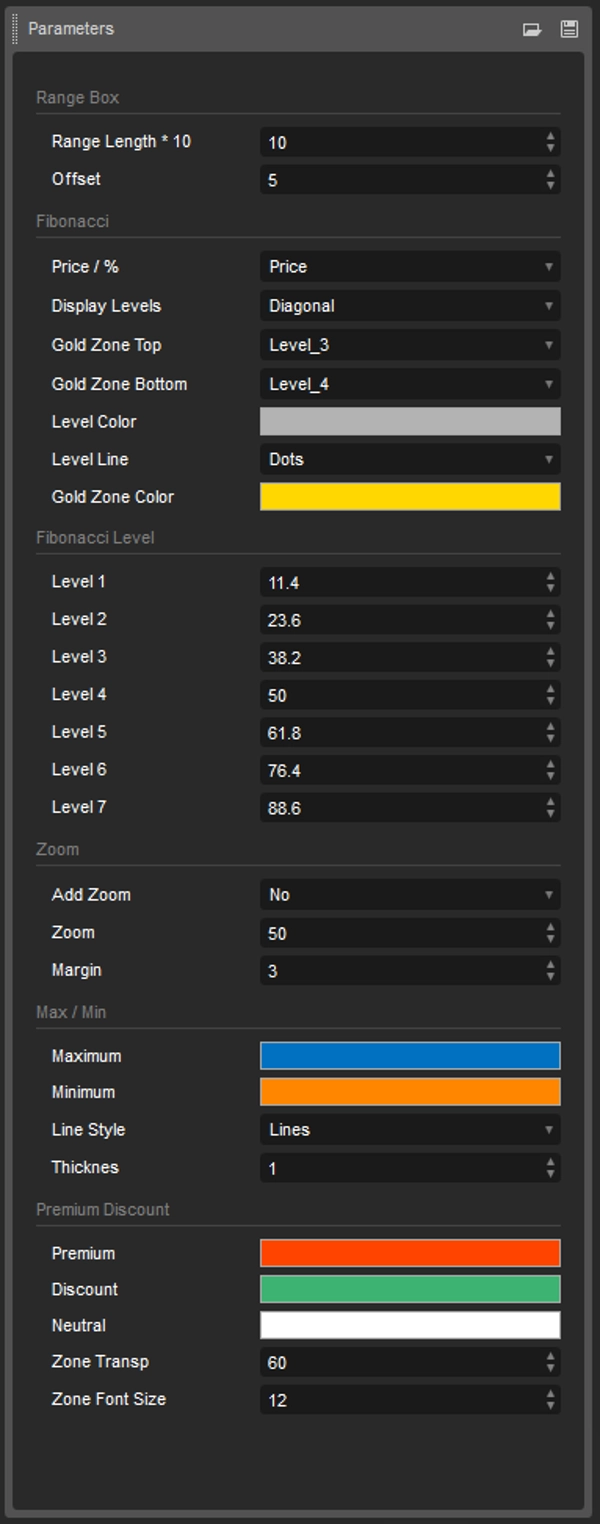
Mit diesem Fibonacci-Retracement-Indikator haben Trader die volle Kontrolle über die im Chart angezeigten Retracement-Level.
Die Möglichkeit, Fibonacci-Level anzupassen, zusammen mit farbigen Zonen und einem separaten Alarm-Indikator, erlaubt es den Nutzern, das Tool an ihre individuellen Handelsstrategien anzupassen.
Wenn Sie Werkzeuge wie:
- OrderPrice V3 https://ctrader.com/products/397
- NTMPICLL https://ctrader.com/products/327
- MACDVolume https://ctrader.com/products/267
- MarketSession-MX https://ctrader.com/products/525
Es gibt keine Möglichkeit, viel Geld zu verlieren.
Zusammenfassung
Kundenbewertungen
5 | 50 % | |
4 | 50 % | |
3 | 0 % | |
2 | 0 % | |
1 | 0 % |


