説明
このテクニカル分析インジケーターは、市場のセンチメント、トレンド、価格レベルに関する情報を提供します。Volume、Open_Close、Chaikin Volatility、Chaikin Money Flowなどのデータを使用して市場のセンチメントを計算します。また、スプレッドの調整、トレンドの検出、価格レベルとピップの可視化も可能です。市場の支配的な力を特定し、価格の動きを予測し、取引の意思決定を改善するための有用なツールです。
説明では重要なパラメーターを示しています。その他は色、線の種類、フォントサイズなどのスタイル設定です。
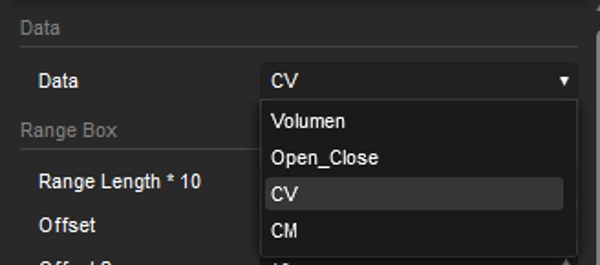
データ
センチメントの計算は、Volume、Open_Close、Chaikin Volatility、Chaikin Money Flowから選択して行います。
レンジ長 * 10
この値は計算の基となるキャンドル(期間)の数を示し、値は10倍されます。
ズーム追加
チャートを中央に保つために、また、レンジ相場やトレンド変化の状況を考慮するのに役立ちます。
マージン
視覚化を改善するために上下のマージンを調整できます。
センチメント表示
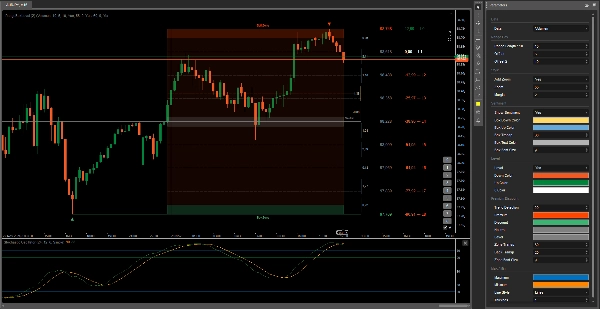
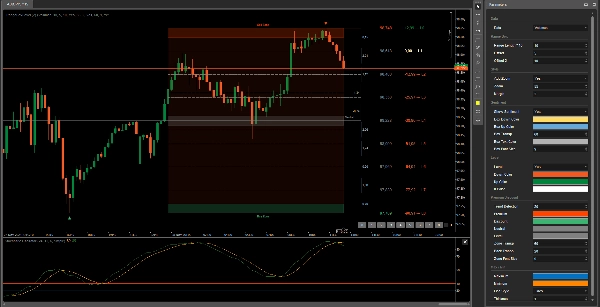
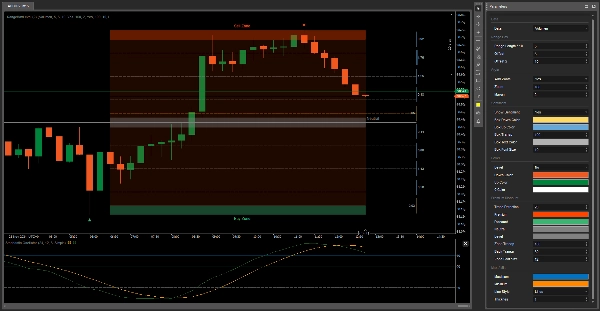
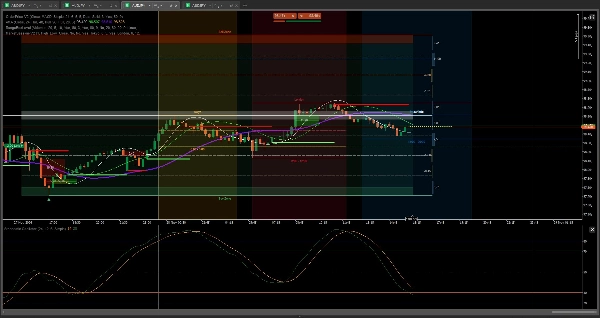
センチメントは現在市場でどちらの勢力が強いかを示します。黄色のバーが大きくなると売り手が多いことを意味し、その逆も同様です。センチメントの可視化を見たくない場合は、右側で非表示にできます。
レベル
これは各レベルの価格とピップの参考として使える追加機能です。買い注文を置きたいレベルを選択すると、価格が到達可能な各レベルのピップ数を示します。
トレンド検出
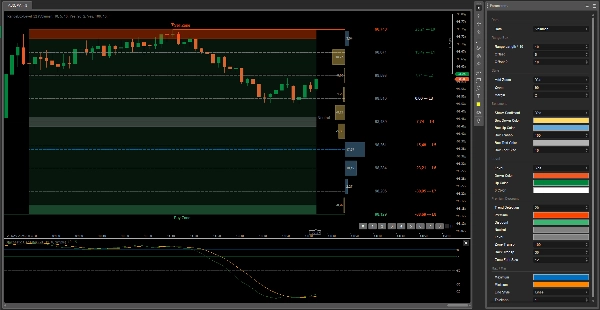
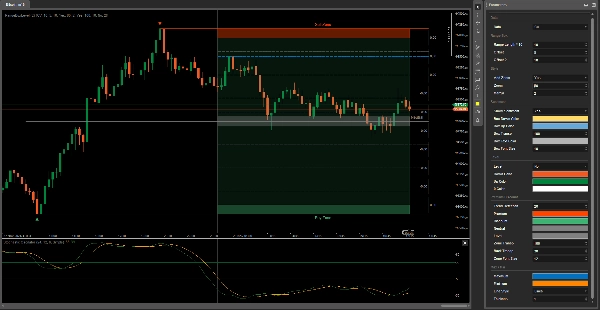
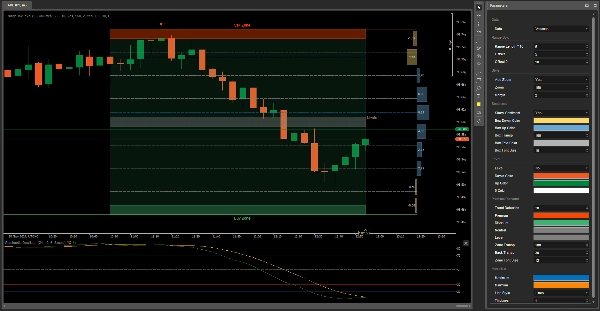
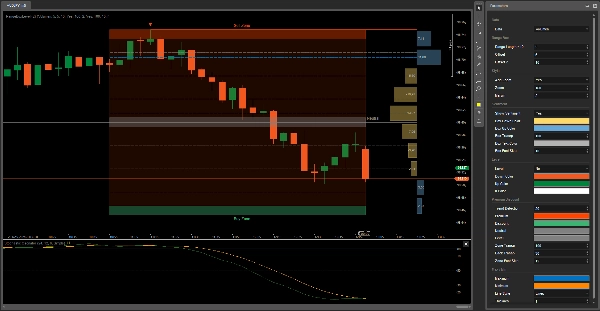
資産のトレンドに応じて、レンジボックスの背景色が変わります:強気の場合は緑、弱気の場合は赤です。
最大 / 最小
これらは価格の予測に応じて位置が変わる青と黄色のラインです。レンジボックスは9つのセクションに分かれており、価格の反転ポイントを判断するのに役立ち、フィボナッチリトレースメントとして機能します。
あなたは無敵になるでしょう
頑張って 😀
概要
Key features include sentiment visualization with bars indicating the dominance of buyers or sellers, trend detection through background color changes (green for bullish, red for bearish), and level indicators that display potential price and pip targets for placing orders. The Range Box is divided into nine sections to identify price inflection points, functioning similarly to Fibonacci retracement levels, with dynamic max/min lines predicting possible price movements.
This tool supports analysis across various markets including stocks, cryptocurrencies, indices like NAS100, and commodities such as XAUUSD (gold). It is suitable for trading strategies like scalping and grid trading and can assist traders in anticipating price movements and making informed decisions. The indicator integrates with additional tools for enhanced order price management and market session analysis.
カスタマーレビュー
5 | 100 % | |
4 | 0 % | |
3 | 0 % | |
2 | 0 % | |
1 | 0 % |