
説明
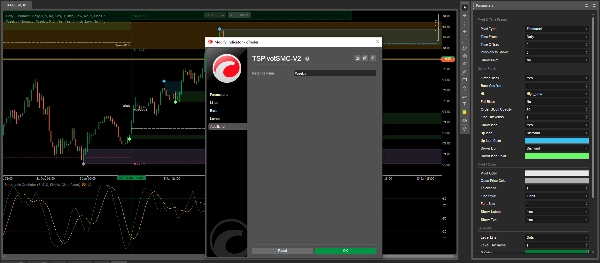
TSPivotSMC-V2: 古典的なピボットと機関投資家の流動性の融合
TSPivotSMC-V2 は単なるピボットポイントインジケーターではなく、機関投資家の精度を求めるトレーダー向けに設計された高度な スマートマネーコンセプト(SMC) マップです。古典的なテクニカル分析の最も信頼されるツールを流動性検出エンジンと高確率ゾーンに変換しました。
主な特徴:
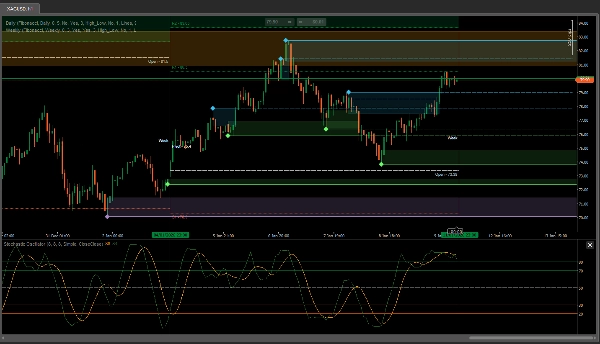
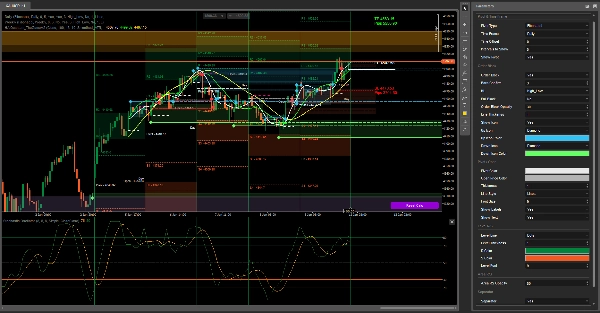
• 自動セッションオーダーブロック:前のセッションの高値と安値のレベルに矩形を識別して描画し、重要な供給と需要のゾーンをマークします。
• インテリジェントな緩和管理:価格によってブロックが破られたときに検出し、実線の矩形を破線の参照線に変更します。これにより、チャートをすっきり保ちながら過去のブレイクアウトを保持できます。
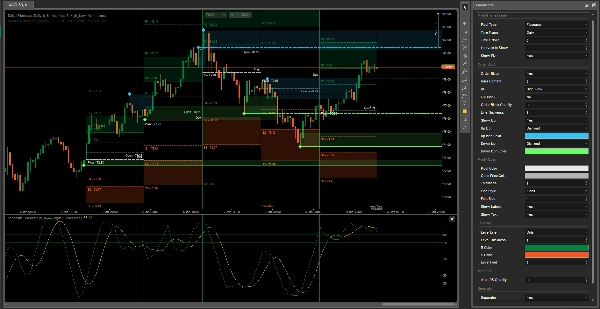
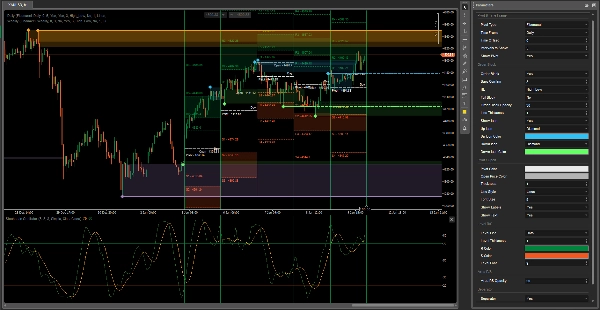
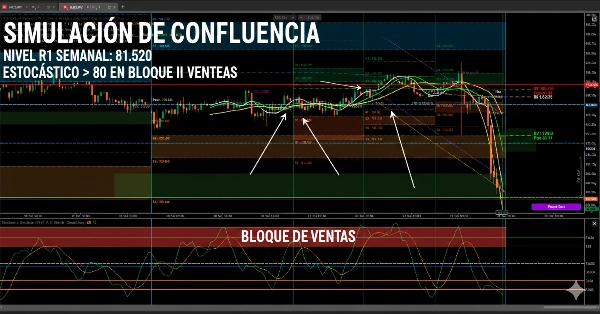
• マルチタイムフレーム(MTF)階層: レイヤーで機能するように設計されています。正確なエントリーのために日足インスタンスを適用し、市場のバイアスを定義するために週足インスタンスを使用することで、影響力の高いコンフルエンスを確認できます。
• プロフェッショナルな確認機能:流動性ゾーンが有効で単なる市場ノイズでないことを保証するためのローソク足確認フィルター(Bars Confirm)を含みます。
• 完全な美的カスタマイズ:各タイムフレームごとに色、透明度、線のスタイルを独立して設定でき、プレッシャー下での迅速な価格読み取りを容易にします。
なぜTSPivotSMCを選ぶのか?
従来のピボットは単に数値を提供するだけですが、TSPivotSMC-V2は市場の物語を提供します。数学的なフィボナッチ/標準レベルと機関投資家の価格アクションを組み合わせることで、資金の流れとその緩和のタイミングを把握でき、cTraderでの独自の競争優位性を得られます。
ストア利用者への注意:「インジケーターの2つのインスタンス(日足と週足)を使用することを推奨します。これにより、高いタイムフレームでの流動性分析の効果が最大化されます。」
概要
Designed for multi-timeframe analysis, TSPivotSMC-V2 supports layering daily and weekly instances to refine entry points and define overall market bias. It includes a candlestick confirmation filter to validate liquidity zones and reduce noise. Users can customize colors, opacities, and line styles independently for each timeframe to enhance visual clarity under trading pressure.
By combining mathematical pivot levels with institutional price action, this tool provides a detailed market narrative, helping traders identify where liquidity resides and when it has been mitigated. It is applicable across multiple markets including Forex, indices, commodities, cryptocurrencies, and stocks. Using multiple timeframe instances is recommended to maximize liquidity analysis effectiveness.
カスタマーレビュー
5 | 100 % | |
4 | 0 % | |
3 | 0 % | |
2 | 0 % | |
1 | 0 % |


