
説明
このインジケーターはリスク管理ツールです。詳細は以下の通りです:
1) 注文タイプ: 指値注文、成行注文、ストップ注文;
2) リスク方法: 固定額(例:200ドル、ユーザーが入力可能)、口座残高の割合(例:1%、ユーザーが入力可能);
3) リスクリワード比: ユーザーがこの値を入力可能、例えば利益の3倍。システムは設定値に基づき、取引可能なロットサイズ、エントリー価格、ストップロスのピップ数と価格、テイクプロフィットのピップ数と価格を自動計算します;
4) エントリー価格: 現在の銘柄の現在価格がデフォルトで、ユーザーが手動で修正・入力可能;
5) ストップロスピップ数: デフォルトはシンボルのスプレッドの10倍(ユーザーが手動で修正・入力可能);
6) ロットサイズ: 自動計算;
7) テイクプロフィット: 自動計算(ピップ数と価格を含む);
8) ストップロス価格: 自動計算。
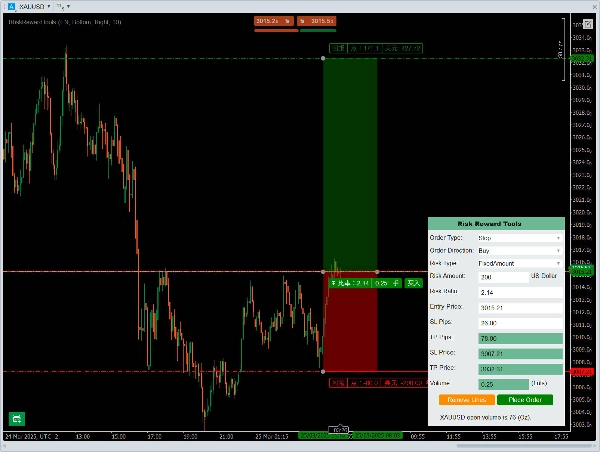
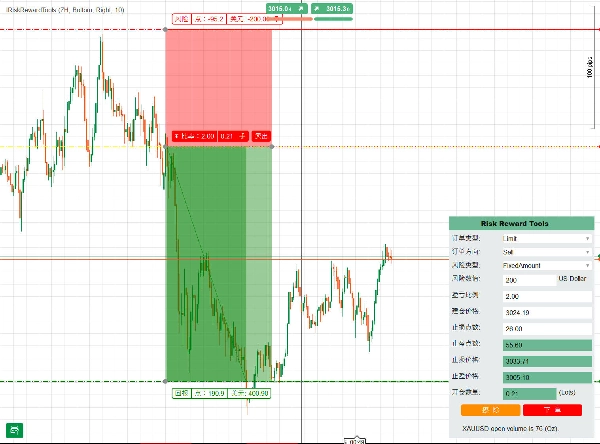
インターフェースの下部には「注文する」ボタンがあり、上記のパラメーター設定に基づいて注文実行操作を行います。
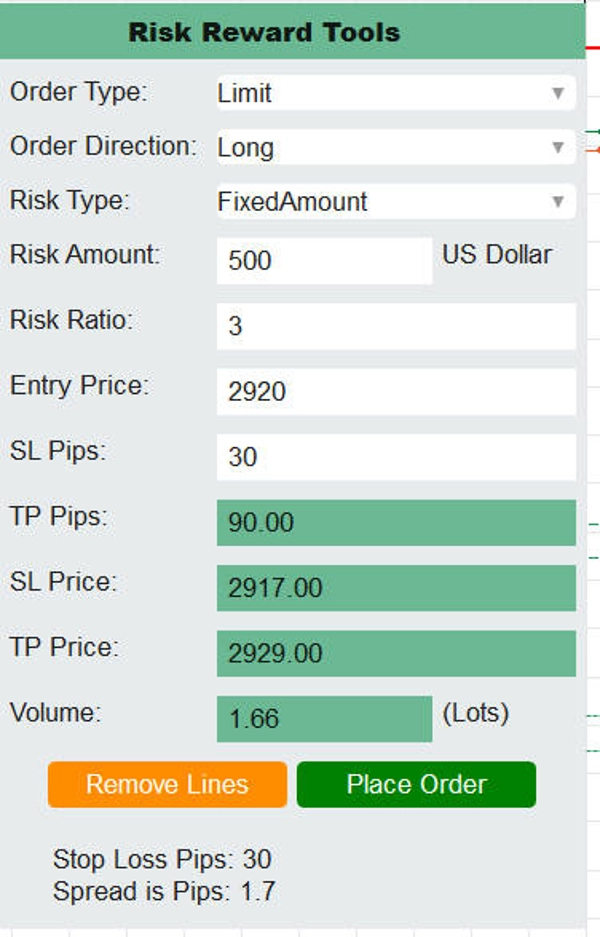
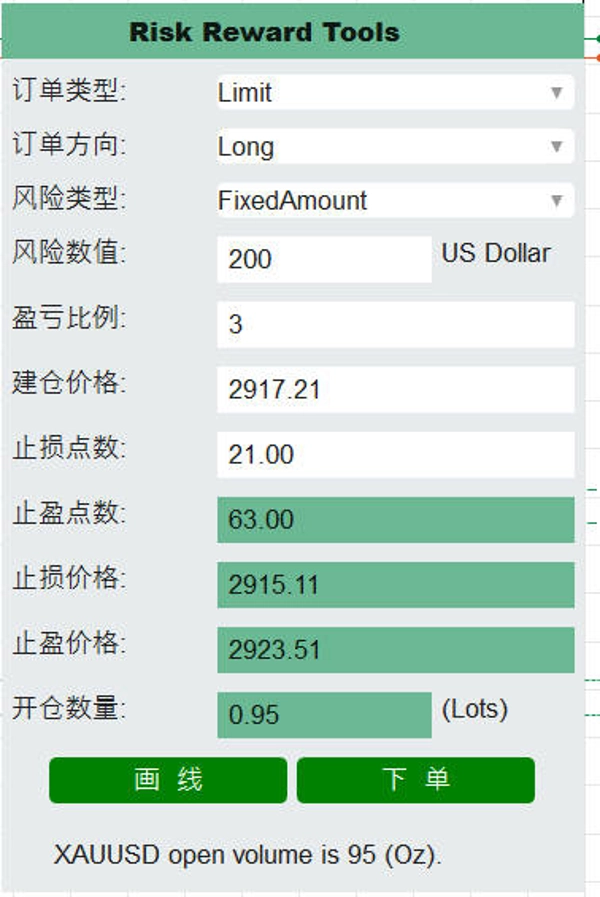
まず、このインジケーターはリスク管理ツールであり、ユーザーインターフェースにはドロップダウンメニュー、テキストボックス、ボタンなどの様々な入力コントロールがあり、注文のロット数、ストップロス、テイクプロフィットなどのパラメーターを計算します。ユーザーは注文タイプ(指値、成行、ストップ)、方向(ロング・ショート)、リスクタイプ(固定額または割合)を選択し、リスク値、リスクリワード比、エントリー価格を入力し、それに基づいてストップロス価格、テイクプロフィットのピップ数・価格、ロット数を計算し、注文機能を提供します。説明は以下の通りです:
1) 注文タイプ:指値注文、成行注文、ストップ注文:
2) リスク方法:固定額(例:200ドル、ユーザーが入力可能)、口座残高の割合(例:1%、ユーザーが入力可能);
3) リスクリワード比:ユーザーが自由に入力可能、例:3倍。システムは設定値に基づき、取引可能なロット数、エントリー価格、ストップロスのピップ数と価格、テイクプロフィットのピップ数と価格を自動計算します;
4) エントリー価格:デフォルトは現在の銘柄の現在価格で、ユーザーが自由に修正・入力可能;
5) ストップロスピップ数:ストップロスピップ数を入力し、ロット数、ストップロス価格、テイクプロフィット価格などの情報を自動計算し、ライン描画機能でチャート上に関連位置情報を表示可能;
6) ロット数:自動計算;
6) テイクプロフィット:自動計算(ピップ数と価格を含む);
7) ストップロス:自動計算(ピップ数と価格を含む)。
インターフェースの最下部には「注文」ボタンがあり、上記のパラメーター設定に基づいて注文実行操作を行います。ビデオ紹介をご覧ください:


