
説明
トレンドラインインジケーターとは?
トレンドラインインジケーターは、トレーダーやアナリストが金融市場のトレンドの方向性と強さを特定するために使用するテクニカル分析ツールです。これは、チャート上の2つ以上の価格ポイントを結ぶ直線を描くことに基づいています。トレンドラインの主な目的は、特定の期間にわたる価格の動きの一般的な方向性を視覚的に表現することです。
マルチタイムフレームトレンドラインインジケーター
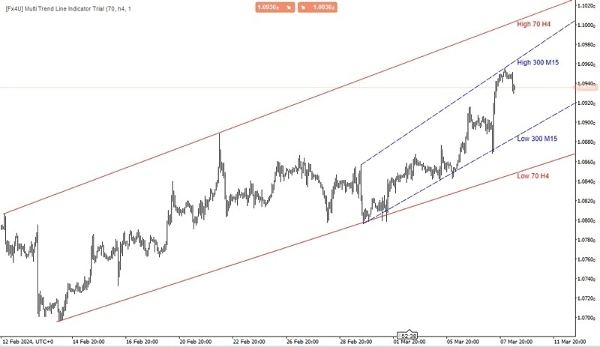
マルチタイムフレームトレンドラインインジケーターの主な機能は、さまざまな時間枠からの情報を集約することで、市場のトレンドに関するより広い視点をトレーダーに提供することです。複数の時間枠にわたるトレンドを分析することで、トレーダーは潜在的なエントリーおよびエグジットポイント、ならびに市場全体の方向性についてより情報に基づいた判断を下すことができます。
このタイプのインジケーターは通常、トレーダーが分析したい時間枠をカスタマイズし、それに応じてトレンドラインを描画できるようにします。異なる時間枠にわたる主要なサポートおよびレジスタンスレベル、トレンドの反転、トレンドの継続を特定するための貴重なツールとなり、トレーダーがより正確な取引判断を下すのに役立ちます。
トレンドラインにはいくつかの種類があります:
- 上昇トレンドライン: これは価格チャート上の2つ以上の連続した安値を結んで描かれます。価格が一般的に時間とともに上昇していることを示す上昇トレンドを示唆します。
- 下降トレンドライン: 逆に、下降トレンドラインは価格チャート上の2つ以上の連続した高値を結んで描かれます。価格が一般的に時間とともに下降していることを示す下降トレンドを示唆します。
- 水平トレンドライン: サポートラインまたはレジスタンスラインとも呼ばれ、価格の動きが停滞または反転しやすい領域を示すために水平に描かれます。
トレーダーはしばしば、他のテクニカルインジケーターや分析手法と組み合わせてトレンドラインを使用し、情報に基づいた取引判断を行います。トレンドラインが破られたり突破されたりすると、トレンドの方向性の潜在的な変化を示し、投資家に取引シグナルを提供する場合があります。
私の他の製品:
https://ctrader.com/products/346
https://ctrader.com/products/336
https://ctrader.com/products/343
https://ctrader.com/products/347
https://ctrader.com/products/148
概要
カスタマーレビュー
5 | 67 % | |
4 | 0 % | |
3 | 33 % | |
2 | 0 % | |
1 | 0 % |
![「[Fx4U] GBPUSD - Price Action」ロゴ](https://cdn.ctrader.com/image/webp/d80b34fc-da3c-4f01-a321-456450665649_26190)

![「[Fx4U] CADJPY - Price Action」ロゴ](https://cdn.ctrader.com/image/webp/1ba81247-b6b7-4f3c-a297-fa3eb1d57fe1_26195)

![「[Fx4U] AUDCHF - Price Action」ロゴ](https://cdn.ctrader.com/image/webp/0a22e9aa-c83b-42cd-b0b8-c1a2da593207_26148)

![「[Fx4U] EURAUD - Price Action」ロゴ](https://cdn.ctrader.com/image/webp/baf8dde4-1ef3-4beb-8ae2-0fed8320f65d_26177)


