
Açıklama
Candles Volume Delta, ham tick hacmini işlem yapılabilir ticaret içgörülerine dönüştüren güçlü, görsel olarak sezgisel bir göstergedir. Alım/satım hacmi baskısına göre fiyat çubuklarını renklendirerek, piyasa duyarlılığı ve gücüne anında görsel bir ipucu sağlar, böylece potansiyel trend devamlarını veya dönüşlerini sadece bir bakışta fark etmenize yardımcı olur.
Ana Özellikler
-
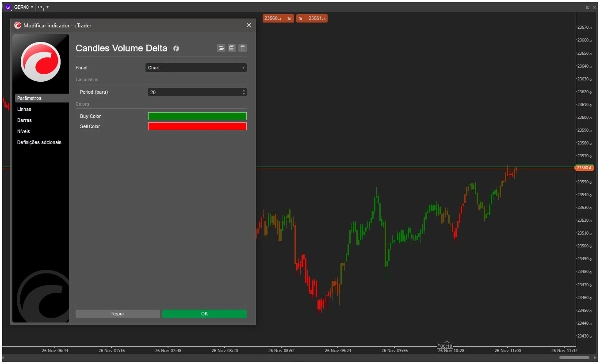
- 🟢 Görsel Hacim Analizi: Her fiyat çubuğunu alım/satım hacmi hakimiyetine göre renklendirir
- 📊 Akıllı Delta Hesaplama: Kullanıcı tarafından tanımlanan bir dönem boyunca hacim deltasını hesaplar
- 🎨 Özelleştirilebilir Renkler: Tamamen ayarlanabilir alım/satım renk şemaları
- ⚡ Gerçek Zamanlı İşleme: Yeni çubuklarda anında görsel geri bildirim için optimize edilmiştir
- 🛠️ Kolay Kurulum: Mantıklı varsayılanlarla basit yapılandırma
Nasıl Çalışır
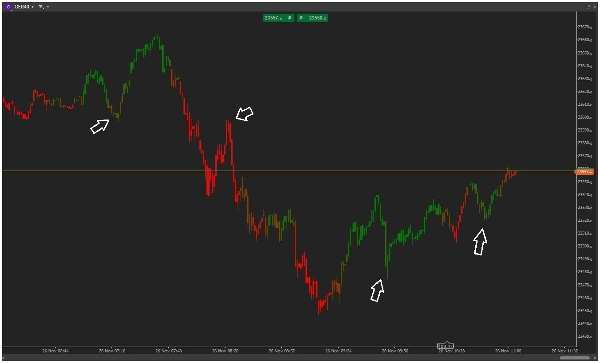
Candles Volume Delta, belirtilen döneminiz boyunca (varsayılan: 20 çubuk) tick hacmini analiz eder ve alım hacminin satış hacmine oranını yüzde olarak hesaplar:
-
- Yeşil Çubuklar: Yüksek alım baskısı (genellikle >%60 alım hacmi)
- Kırmızı Çubuklar: Yüksek satış baskısı (genellikle <%40 alım hacmi)
- Gradyan Renkler: Ara güç seviyelerini gösteren yumuşak renk geçişleri
Gösterge, mevcut piyasa volatilitesine uyum sağlamak için ATR tabanlı yumuşatma kullanarak istikrarlı ve anlamlı sinyaller sağlar.
Ticaret Uygulamaları
-
- Trend Onayı: Hacim onayı ile trend gücünü doğrulayın
- Dönüş Sinyalleri: Fiyat hareketi hacim akışına aykırı olduğunda potansiyel dönüşleri tespit edin
- Kırılma Doğrulaması: Destekleyici hacim kanıtlarıyla kırılmaları onaylayın
- Piyasa Duyarlılığı: Herhangi bir zaman diliminde genel alıcı/satıcı hakimiyetini ölçün
Neden Candles Volume Delta?
Grafiğinizi karmaşık hale getiren hacim göstergelerinin aksine, Candles Volume Delta basit renk kodlamasıyla anında görsel geri bildirim sağlar. Hafif, hızlıdır ve sizi bunaltmadan gerekli temel hacim bilgilerini sunar.
Şu özelliklere sahip tüccarlar için mükemmel:
-
- Hızlı piyasa duyarlılığı değerlendirmesi
- Temiz, karmaşık olmayan grafik analizi
- Fiyat hareketlerinin görsel onayı
- Mevcut stratejilere kolay entegrasyon
Bugün kurun ve hacim dinamiklerinin merceğinden piyasaları görün!
Özet
Key features include customizable color schemes, real-time processing for instant visual feedback, and easy setup with sensible defaults. The indicator helps traders quickly assess market sentiment, confirm trends, identify potential reversals, validate breakouts, and gauge buyer/seller dominance across timeframes. It is designed to provide essential volume insights without cluttering the chart, making it suitable for integration into various trading strategies, including scalping and trend analysis. Supported markets include indices and other instruments where volume analysis is relevant.
Müşteri değerlendirmeleri
5 | 100 % | |
4 | 0 % | |
3 | 0 % | |
2 | 0 % | |
1 | 0 % |


