
الوصف
ملف حجم دلتا العدوان (تجميع التيك الحقيقي)
ارتقِ بتحليلك للسوق مع ملف حجم دلتا العدوان، أداة تدفق التيك عالية الجودة للمؤسسات مصممة حصريًا لـ cTrader. بخلاف ملفات الحجم القياسية التي تعتمد على تقديرات غير دقيقة، توفر هذه الأداة شفافية مطلقة من خلال رسم الحجم بالضبط حيث تمت المعاملات.
المشكلة مع ملفات الحجم القياسية
تستخدم معظم ملفات الحجم في السوق اختصارًا: تأخذ الحجم الكلي للشمعة وتوزعه بشكل مصطنع عبر نطاق الأعلى والأدنى. هذا يخلق تقديرًا مخمّنًا ومُنعّمًا يفشل تمامًا في الكشف عن الكتل المؤسسية المخفية، والمتداولين المحاصرين، والعقد ذات السيولة العالية الفعلية.
حل دلتا العدوان: تجميع التيك الحقيقي
لا يخمن ملف حجم دلتا العدوان. إنه يستفيد من محرك التيك التاريخي الأصلي في cTrader لمعالجة كل تحديث سعر خام ضمن المنطقة التي تختارها. يحسب الحجم الدقيق المتداول عند كل نقطة سعر كسرية دقيقة ويقسمه إلى دلتا شراء/بيع في الوقت الحقيقي. ما تراه ليس تقريبًا — إنه البصمة الحرفية لسيولة السوق.
الميزات الرئيسية
-
- معالجة بيانات التيك التاريخية الحقيقية: استخدام بيانات تاريخ التيك بدقة المللي ثانية لتوليد هيكل حجم حي غير متنازل عنه.
- وضعيات تثبيت بمحرك مزدوج:
-
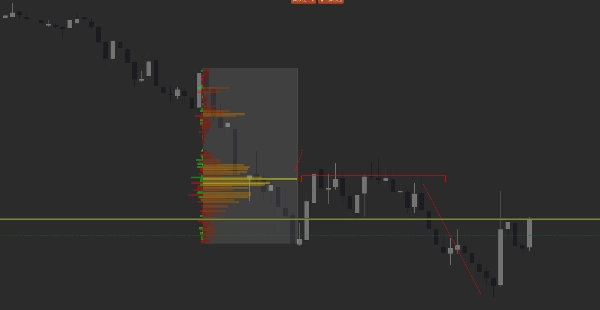
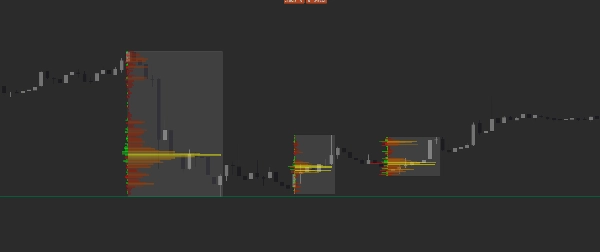
- وضع خط الاتجاه: ارسم ببساطة خط اتجاه قياسي فوق أي تأرجح أو موجة لتغليف ملف حجم محلي تلقائيًا بين وقت البداية والنهاية. يدعم ملفات متعددة متزامنة ومحاذاة لليسار/اليمين.
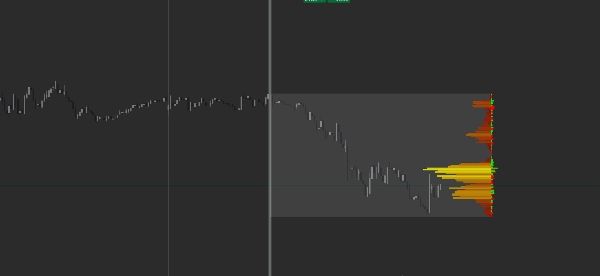
- وضع الخط العمودي (التثبيت): اسقط خطًا عموديًا في أي مكان على الرسم البياني لتثبيت ملف ديناميكي يمتد من تلك النقطة الهيكلية الرئيسية حتى شمعة السوق الحية الحالية.
- وضع خط الاتجاه: ارسم ببساطة خط اتجاه قياسي فوق أي تأرجح أو موجة لتغليف ملف حجم محلي تلقائيًا بين وقت البداية والنهاية. يدعم ملفات متعددة متزامنة ومحاذاة لليسار/اليمين.
- خريطة حرارة متقدمة للحجم ودلتا تدفق التيك:
-
- تصور التركيز بتدرج لوني ناعم يبرز العقد ذات الحجم العالي (مناطق POC) مقابل الفراغات ذات الحجم المنخفض.
- يتميز بملف دلتا متداخل (تتبع الشراء مقابل البيع) بناءً على أوامر السوق العدوانية تيك بتيك، يظهر لك فورًا من يسيطر على مستوى سعر معين.
- تصور التركيز بتدرج لوني ناعم يبرز العقد ذات الحجم العالي (مناطق POC) مقابل الفراغات ذات الحجم المنخفض.
- تحسين تجربة المستخدم بدون وميض: مبني مع حالات تحميل بيانات غير متزامنة وبنية تخزين ذكية لضمان بقاء الرسوم البيانية سلسة للغاية، سريعة الاستجابة، وخالية من تأخر واجهة المستخدم أثناء تقلبات السوق الشديدة.
- معالجة بيانات التيك التاريخية الحقيقية: استخدام بيانات تاريخ التيك بدقة المللي ثانية لتوليد هيكل حجم حي غير متنازل عنه.
كيفية استخدامه
-
- تحديد ملف خط الاتجاه: ارسم خط اتجاه لعزل جلسة تداول محددة، حدث إخباري، أو موجة تصحيحية. يخفي المؤشر خط الاتجاه تلقائيًا ويستبدله بملف حجم مخصص وجميل. اختر بالضبط عدد خطوط الاتجاه التي تتحول إلى ملفات حجم. أي خطوط اتجاه إضافية ترسمها بعد هذا الحد ستعمل تلقائيًا كخطوط رسم بياني قياسية.
- تحديد ملف التثبيت العمودي: ضع خطًا عموديًا عند أعلى/أدنى تأرجح رئيسي، افتتاح جلسة، أو وقت صدور بيانات الاقتصاد الكلي. سيتم تحديث الملف ديناميكيًا مع كل تيك وارد، معروضًا بشكل مرتب على الجانب الأيمن من الرسم البياني مع تعويضات قابلة للتخصيص حتى لا يحجب حركة السعر. فقط أحدث خط عمودي يعمل كمرساة ملفك الديناميكي. أي خطوط عمودية ثانوية تضعها على الرسم البياني ستظل تلقائيًا خطوطًا عمودية قياسية غير معدلة.
- تحديد ملف خط الاتجاه: ارسم خط اتجاه لعزل جلسة تداول محددة، حدث إخباري، أو موجة تصحيحية. يخفي المؤشر خط الاتجاه تلقائيًا ويستبدله بملف حجم مخصص وجميل. اختر بالضبط عدد خطوط الاتجاه التي تتحول إلى ملفات حجم. أي خطوط اتجاه إضافية ترسمها بعد هذا الحد ستعمل تلقائيًا كخطوط رسم بياني قياسية.
المواصفات الفنية والمعايير
-
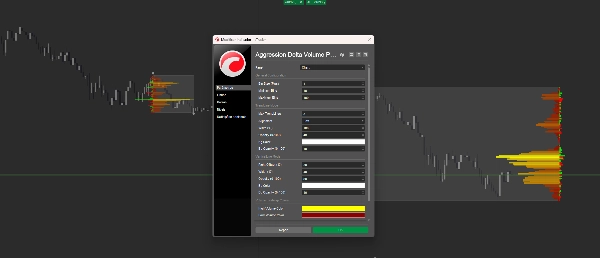
- حجم الصندوق (بيب): دقة قابلة للتخصيص بالكامل (من الميكروسكالبينج 0.1$ بيب إلى الهياكل الكبرى).
- عتبات الصندوق: تعيين حدود دنيا وعليا للحفاظ على نظافة التخطيط بغض النظر عن تقلبات السوق.
- التحكم في الجماليات: تحكم كامل في الشفافية، تعبئة الخلفية، تدرجات خريطة الحرارة، وألوان الدلتا لتتناسب تمامًا مع أي موضوع رسم بياني داكن أو فاتح.
- حجم الصندوق (بيب): دقة قابلة للتخصيص بالكامل (من الميكروسكالبينج 0.1$ بيب إلى الهياكل الكبرى).
لماذا تختار هذا المؤشر؟
إذا كنت تتداول اختراقات الدعم/المقاومة، نظرية سوق المزاد، أو كتل أوامر المؤسسات، فإن تخمين توزيع الحجم يكلفك المال. امنح نفسك الأفضلية الحاسمة مع مؤشر يحول بيانات التيك الخام إلى مناطق تنفيذ عالية الاحتمالية وقابلة للتنفيذ.
احصل على ملف حجم دلتا العدوان اليوم وابدأ برؤية السوق الحقيقي.
الملخص
Key features include two anchoring modes: Trendline Mode, which creates localized volume profiles between drawn trendline points, and Vertical Line Mode, which anchors dynamic profiles from a chosen price level to the current market. The indicator visualizes volume concentration with a heatmap highlighting high-volume nodes and overlays a Delta Profile to track aggressive buy versus sell orders. It supports customizable bin sizes and thresholds for granular volume analysis and offers full aesthetic controls for integration with various chart themes.
The indicator is optimized for smooth performance with asynchronous data loading and caching to maintain responsiveness during volatile market conditions. It is suited for traders focusing on support/resistance breakouts, auction market theory, and institutional order blocks by providing actionable insights based on exact tick-level volume data.


